Butler SOS: real-time server stats for Qlik Sense

I got somewhat distracted from the idea of breaking up the existing Butler software into smaller, stand-alone micro services.
Or rather, an idea came to mind. An idea too good not to explore…
The healthcheck API of Qlik Sense provides basic metrics for both the Qlik Sense engine itself, and the server it is running on. Things like CPU load, available RAM, number of connected users and what apps are loaded into the Sense engine.

The idea behind Butler SOS ( SOS = SenseOps Stats) is very simple:
Get the healthcheck metrics for all servers in a Sense cluster. Then send the information to MQTT for immediate, real-time use cases.
It is directly aimed at bringing better features to the monitoring step of SenseOps – please visit SenseOps.rocks for more info on SenseOps (edit: That is no longer online. It was built on old tech and it took too much time maintaining it).
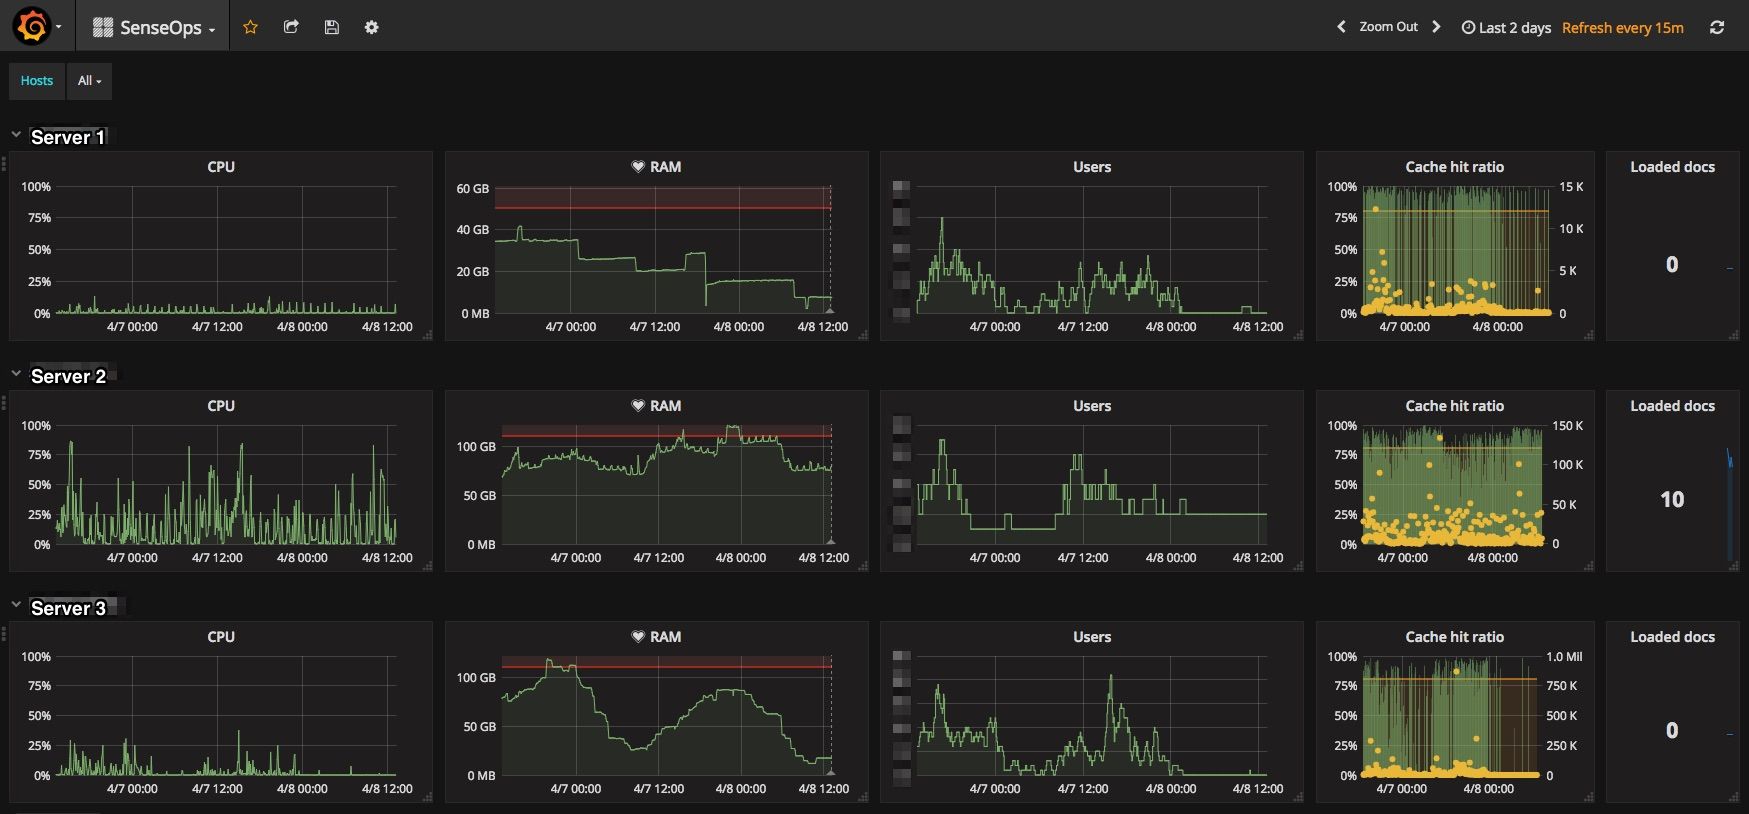
Butler SOS is nice and sending data via MQTT make the health metrics available in for example Node-RED. Node-RED has some basic graph options, but not anywhere near those offered by Grafana. Grafana is very, very cool… A live demo is available here – do check it out – it is very nice indeed.
Creating real-time dashboards in Grafana is greatly simplified if the data is stored in some kind of time series database. Influxdb is an obvious choice. It is open source, installation is very easy, and there are good Node.js libraries that make it trivial to insert data into a Influxdb database.
Thus – Butler SOS also sends the Sense health metrics to an Influx db of choice.
Only need Influxdb and not MQTT? Or the other way around?
No problem, the Butler SOS config file include options for independently turning on/off sending of data to MQTT and Influxdb.
Butler SOS, including a sample Grafana dashboard, is available on GitHub.
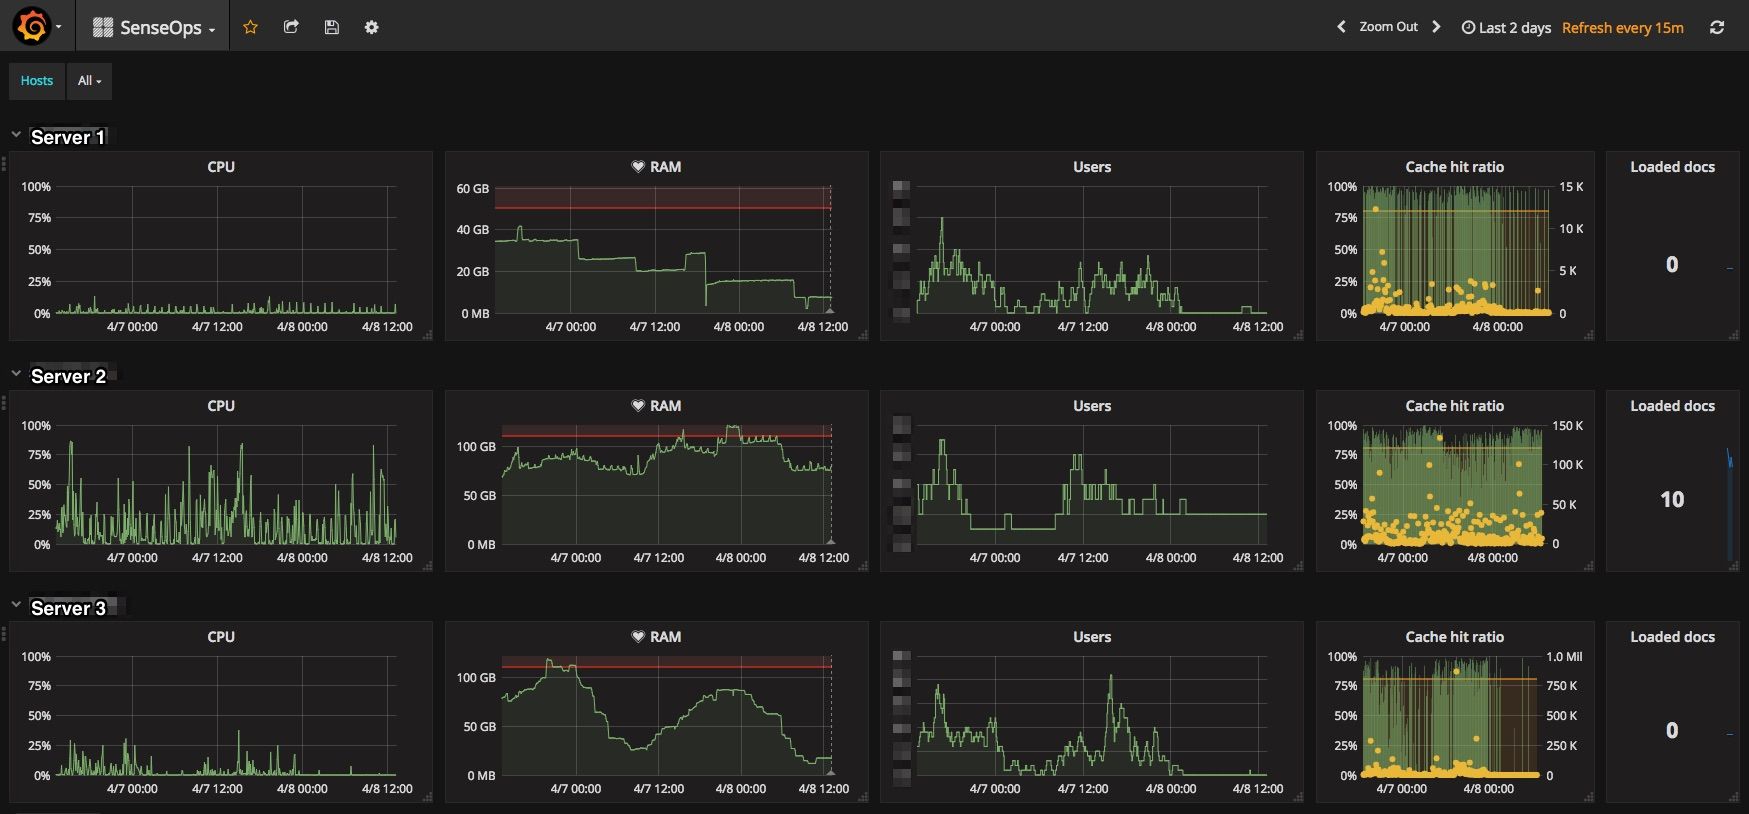
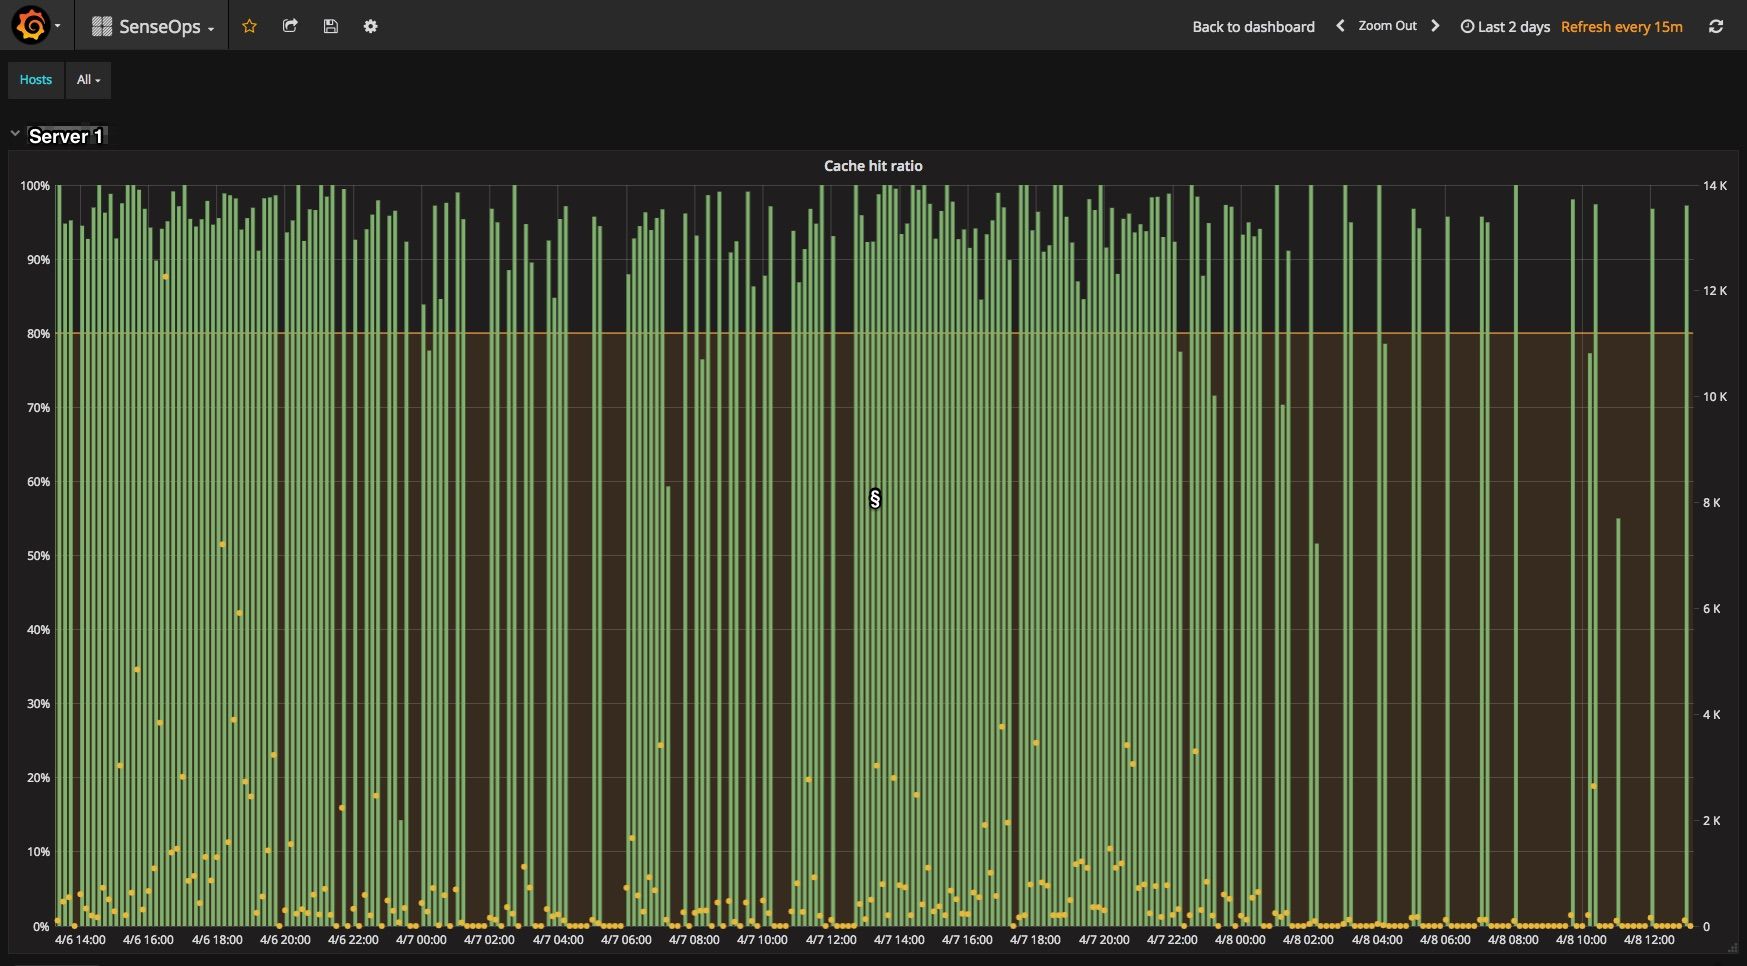
Using Grafana we get dashboards and charts like these:


Available metrics
The following metrics are available over MQTT as well as in Influxdb (for each server in the Sense cluster, if so desired). Please refer to the healthcheck API documentation for details.
Sense server
Version
Started
Uptime
Memory
Comitted
Allocated
Free
Apps
Active documents count
Loaded documents count
Calls Selections
CPU
Total load
Sessions
Currently active user sessions
Total connected user sessions
Users
Currently active users
Total connected users
Cache
Hits
Lookups
Added
Replaced
Bytes added
Getting started
There are a few steps needed to get Butler SOS off the ground. The GitHub repository also contains some documentation.
This section assumes you have a working understanding of how to install software on Linux servers and how to configure and manage a Qlik Sense Enterprise site.
Please note that both Influxdb and Grafana require some Linux(ish) computer. Debian, Ubuntu or OSX should all be ok. It is also possible (and very convenient!) to run Influxdb and Grafana in Docker containers.
First, install Influxdb and Grafana. Instructions are available here and here. There are also various tutorials available on the web.
Butler SOS itself can be run either alongside Influxdb and Grafana on the Linux/OSX server, or on Windows (e.g. a Sense server). Linux tends to be a better choice in cases like these, even though Node.js on Windows works just fine. The tricky part when running Node.js apps on Windows is to auto-start them when the Windows server boots. There is no really good solution for this, going with a Linux server is therefore preferred.
Finally, Qlik Sense itself also need some changes.
Specifically, Butler SOS relies on virtual proxies to be available for each server that is to be monitored. Please refer to the README file on GitHub for details on this.
Room for improvement
This is very much a first version of Butler SOS. On the to-do list right now are things such as
- Retrieving the name of all apps loaded into the engine. The healthcheck API only return app gids. By using the Sense repository APIs it is possible to match those gids to actual app names.
- Add more metrics, for example free disk space on each server. This would require integration with Windows APIs – pretty easy though given the availability of existing Node.js modules doing exactly this.
- Use Sense’s own certificates to query each engine’s healthcheck API directly, without having to go through a virtual proxy for each Sense server. This would simplify the setup significantly.
Missing ops metrics in Sense
It would also be nice if Qlik would add more Sense-related metrics to the healthcheck API (or other/new APIs focusing on the status of a Sense environment):
- Current number of ongoing reloads, with information on whether they were started by the Sense scheduler or manually, what user started a manuel reload. Per server of course.
- Information on what users are connected to what servers. Right now the healthcheck API give us number of connected users, but not who they are.
Some of the above missing metrics are (probably) hard to implement without Qlik adding additional APIs to Sense – let’s hope good things come to those who wait…
