Interactive onboarding tours for Qlik Sense
Build guided, step-by-step onboarding tours for your Qlik Sense apps with onboard.qs. A visual tour editor, Markdown content, theming presets, and import/export — all in a single lightweight extension that works on both Qlik Cloud and Qlik Sense Enterprise on Windows.

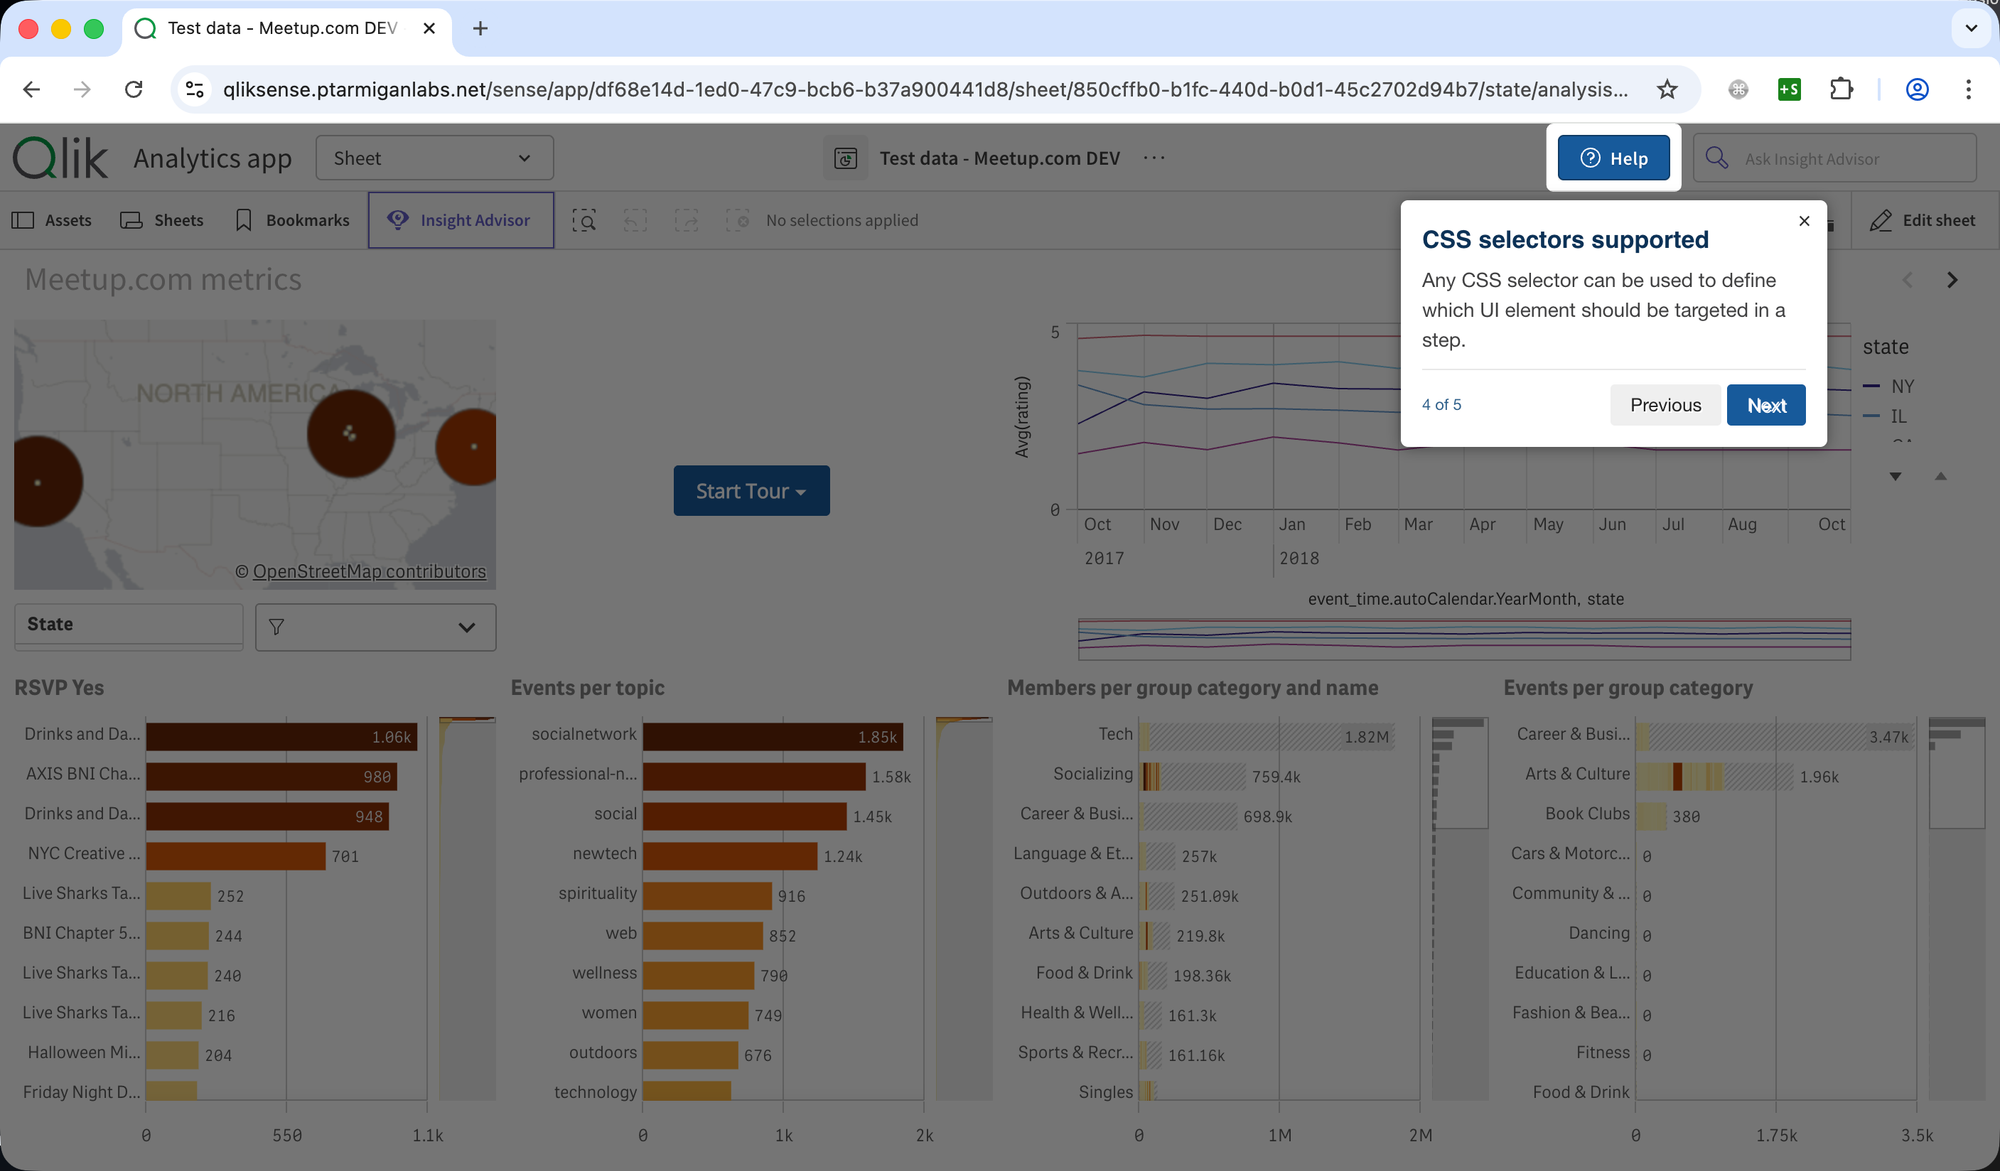
You've built a Qlik Sense app with dozens of visualisations, carefully tuned selections, and a logical sheet structure. You publish it. And then the first thing you hear is: "I opened it but I don't really know what I'm looking at."
Training documents go unread. Walkthrough videos get bookmarked and forgotten. New users bounce between sheets, miss the key KPIs, and eventually ask a colleague to explain the dashboard in a Teams call.
The problem isn't bad apps — it's missing context. Users need guidance inside the app, at the moment they're using it.
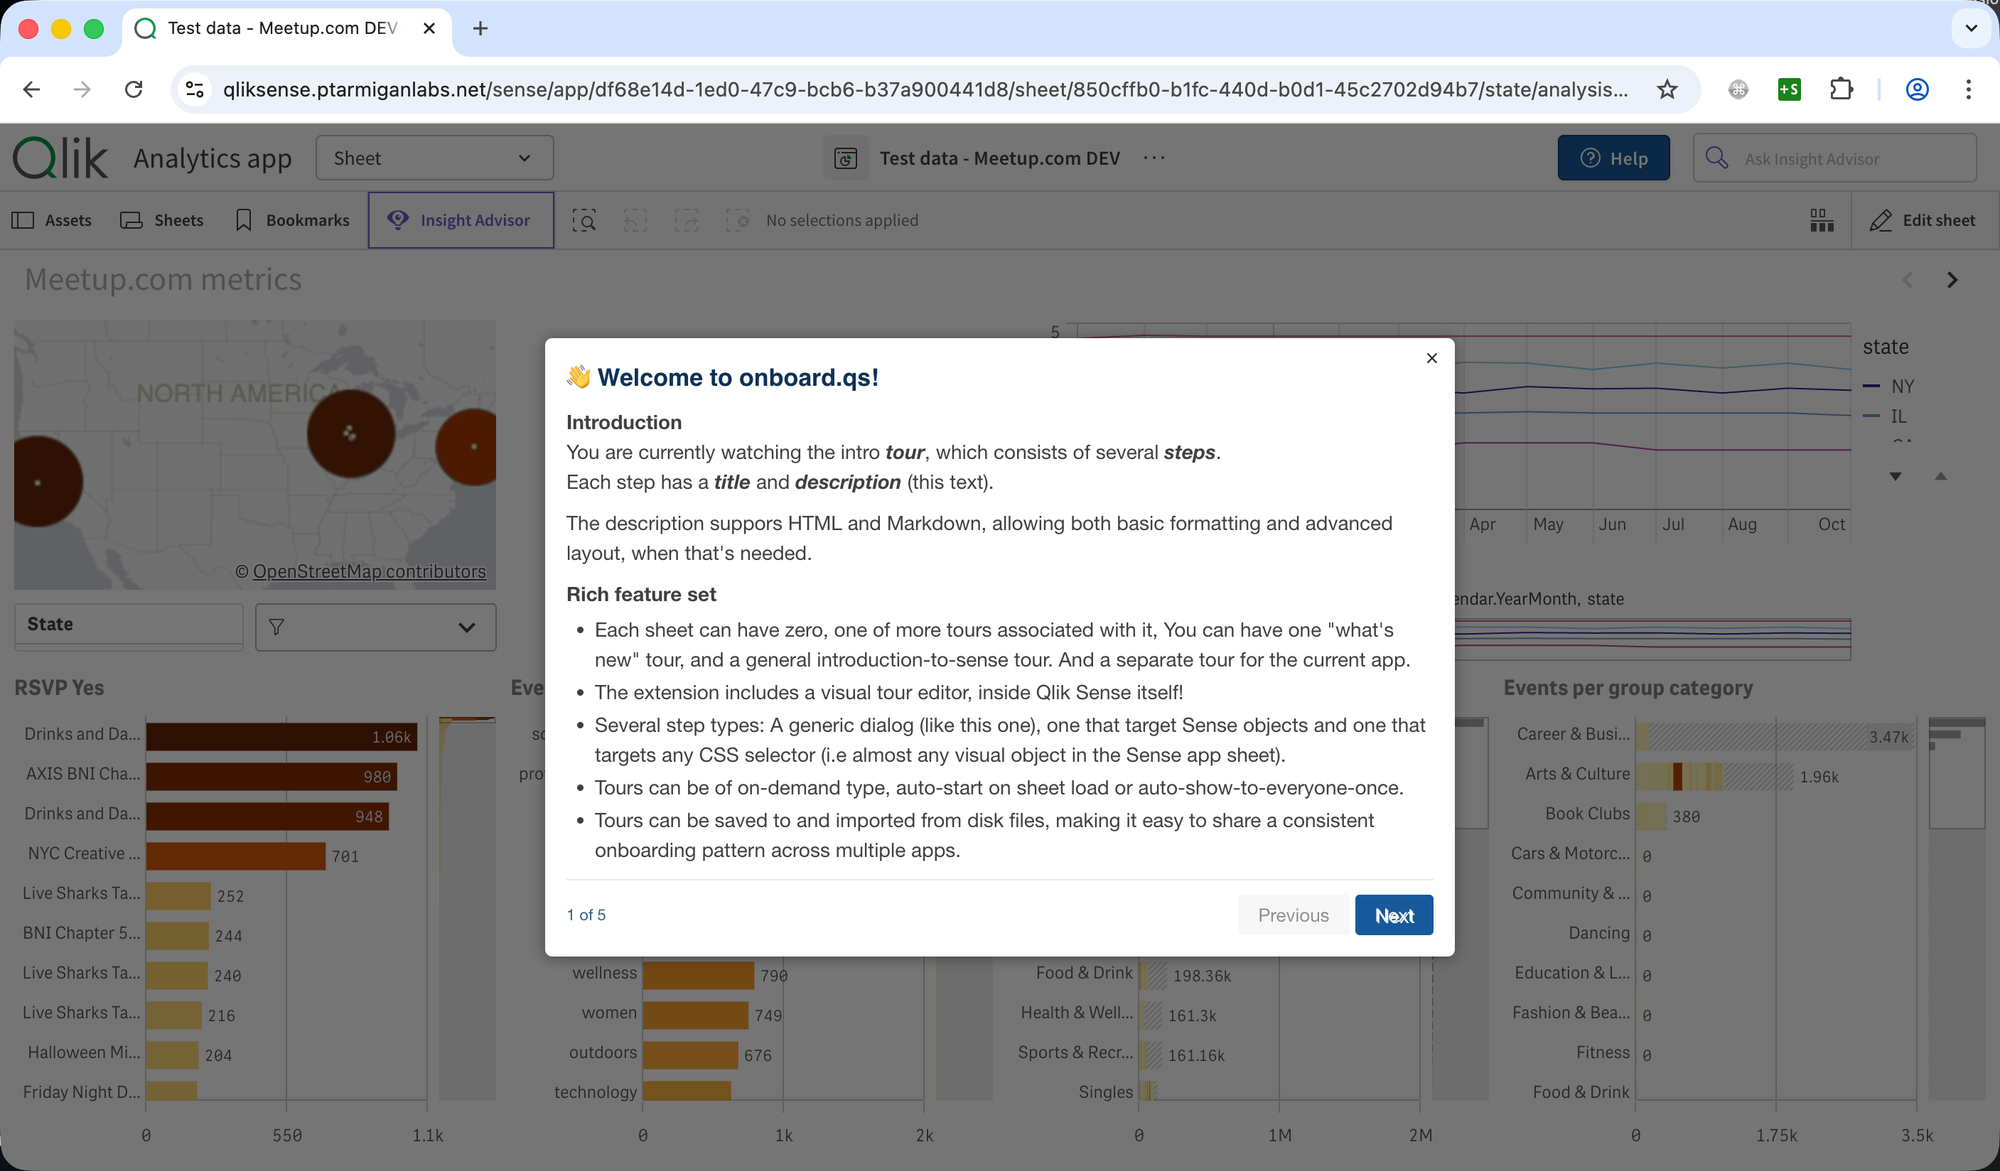
Onboard.qs is an open source (free to use!) Qlik Sense extension that adds interactive, step-by-step onboarding tours directly into your apps. Drop it onto a sheet, open the visual tour editor, and create guided walkthroughs that highlight objects, explain charts, and onboard new users — no coding required.
And it works on both Qlik Cloud and Qlik Sense Enterprise on Windows (client-managed). Same extension, same features, automatic platform detection.
Here is a demo of onboard.qs in action:
Works on both Qlik Cloud and client-managed
This is worth emphasising: onboard.qs runs on both Qlik Cloud and client-managed QSEoW. The extension detects which platform it's running on automatically — no configuration needed, no toggling between modes.
Whether you're fully in the cloud, still running on-premises, or managing a hybrid environment, you deploy the same zip file and get the same experience. Tours, theming, import/export — everything works on both platforms.
Visual tour editor — no coding, no context switching
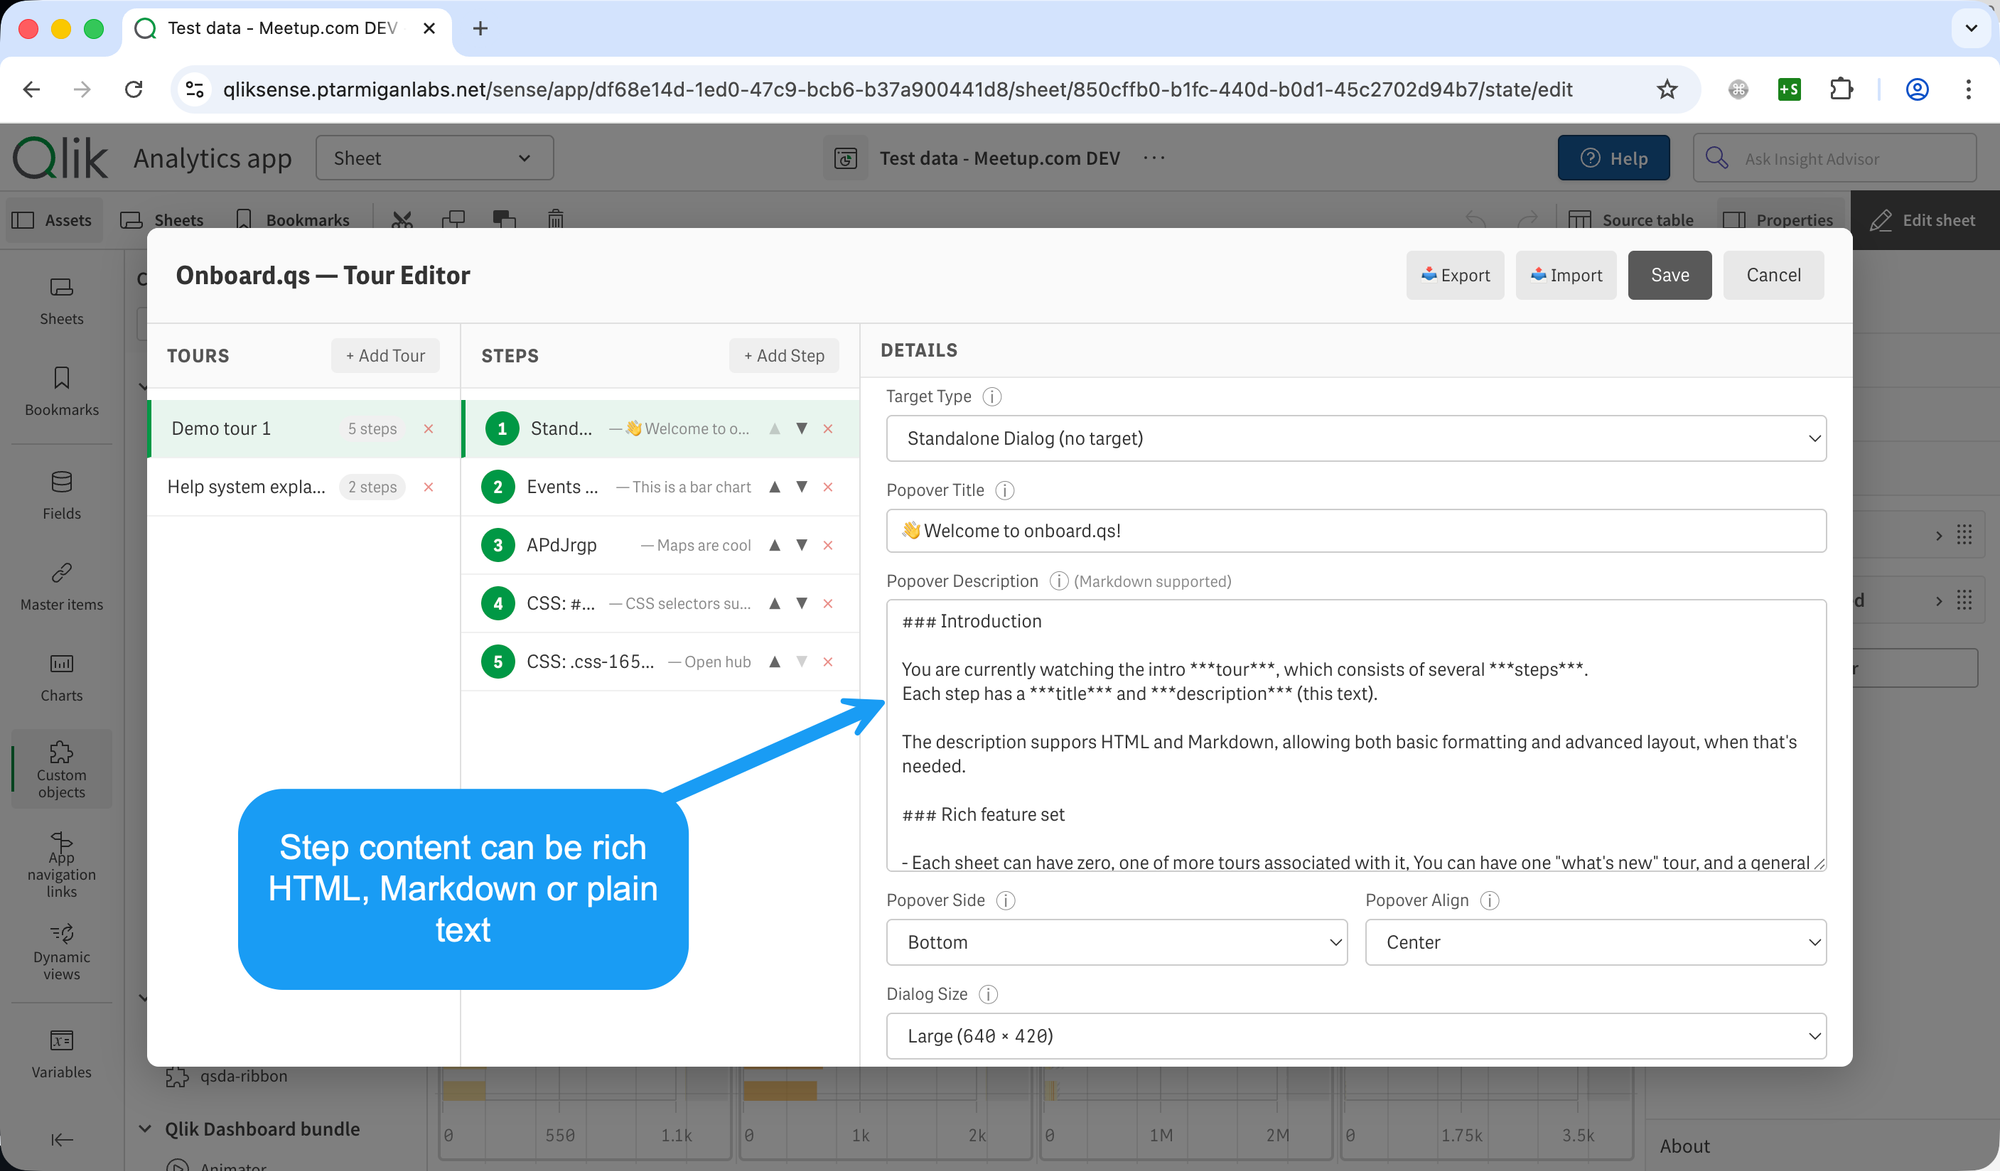
The heart of onboard.qs is the tour editor: a full-screen modal with a three-panel layout for managing tours, steps, and step details. You never leave the Qlik Sense environment.
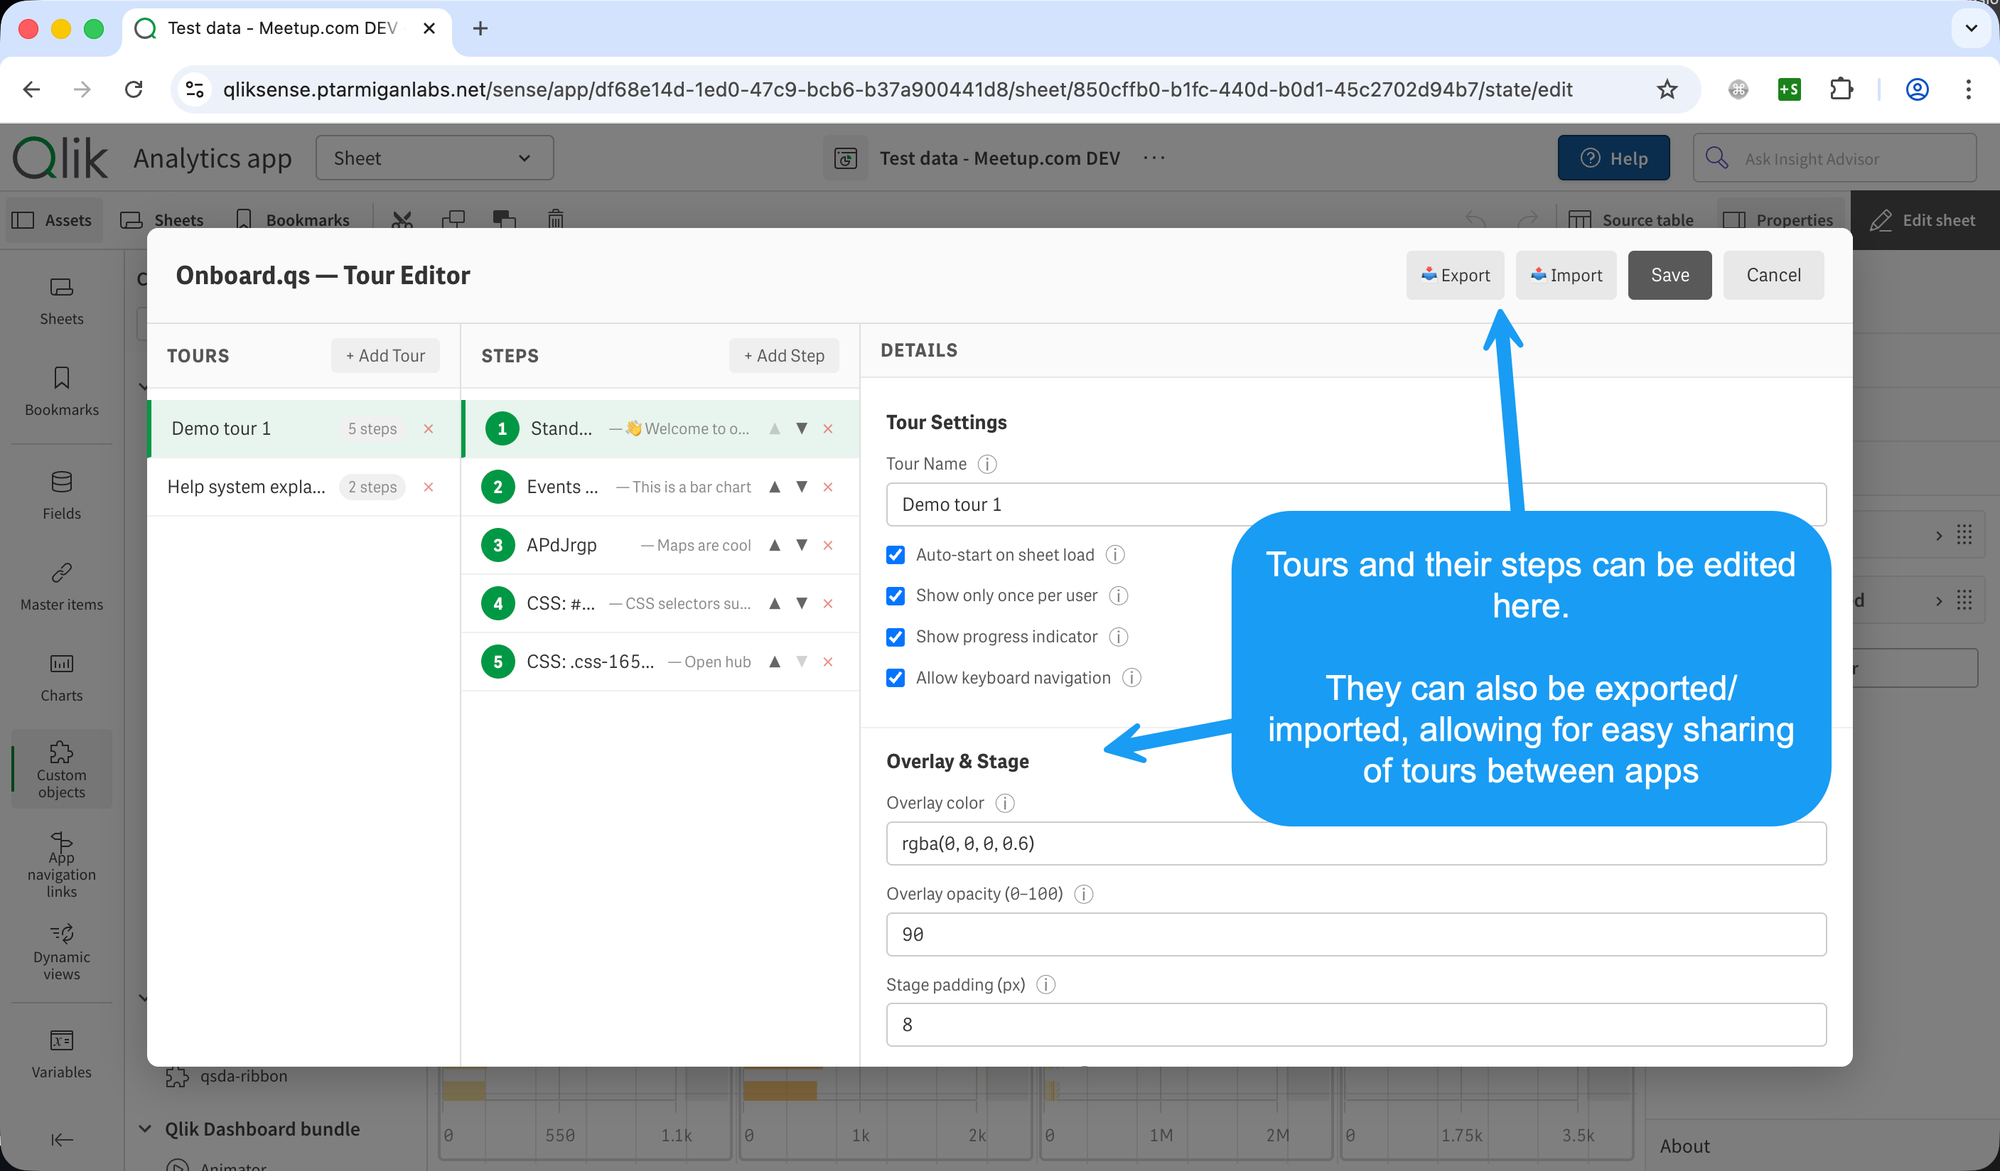
Creating a tour is straightforward:
- Click Open Tour Editor on the extension.
- Add a tour, give it a name.
- Add steps. For each step, pick a target visualisation from a dropdown of all objects on the current sheet — or switch to Custom CSS Selector to target any DOM element (toolbar buttons, headers, other extensions) - or choose Standalone Dialog for a non-targeted modal step.
- Write a title and description for each step. Markdown is fully supported — bold, italic, links, images (including base64-embedded), lists, blockquotes, code, and more.
Prefer HTML? You can use that too. - Save. Switch to analysis mode and click Start Tour.
Each step includes a live preview — click "Preview Step" and the extension creates a temporary highlight on the actual target object, auto-dismissing after a few seconds so you can verify targeting without running the full tour.

Standalone dialog steps
Not every tour step needs to point at a specific object. Onboard.qs supports standalone dialog steps — centered modals with no target element. These are ideal for intro messages ("Welcome to the Sales Dashboard"), summary slides, or conclusions.
You can choose from five predefined sizes (Small through Extra Large), a dynamic size that fits the content, or specify custom pixel dimensions.
Auto-start and show-once
Tours can be configured to launch automatically when a sheet loads — useful for onboarding new users without requiring them to click anything.
This feature can also be used to explain new features or changes when updating an existing app. For example, if you add a new chart or sheet, you can create a tour that highlights the new content and set it to auto-start, ensuring all users see the update.
To avoid annoying returning users, onboard.qs tracks whether a user has already seen a tour using the user browser's local storage. Once a tour has been viewed, it won't auto-start again. But when you update the tour content, you can bump the tour version number to reset the "seen" flag for all users, so everyone sees the latest version.
This is the kind of detail that makes onboarding practical in production: new users get guided, experienced users aren't interrupted, and updates are easy to push.
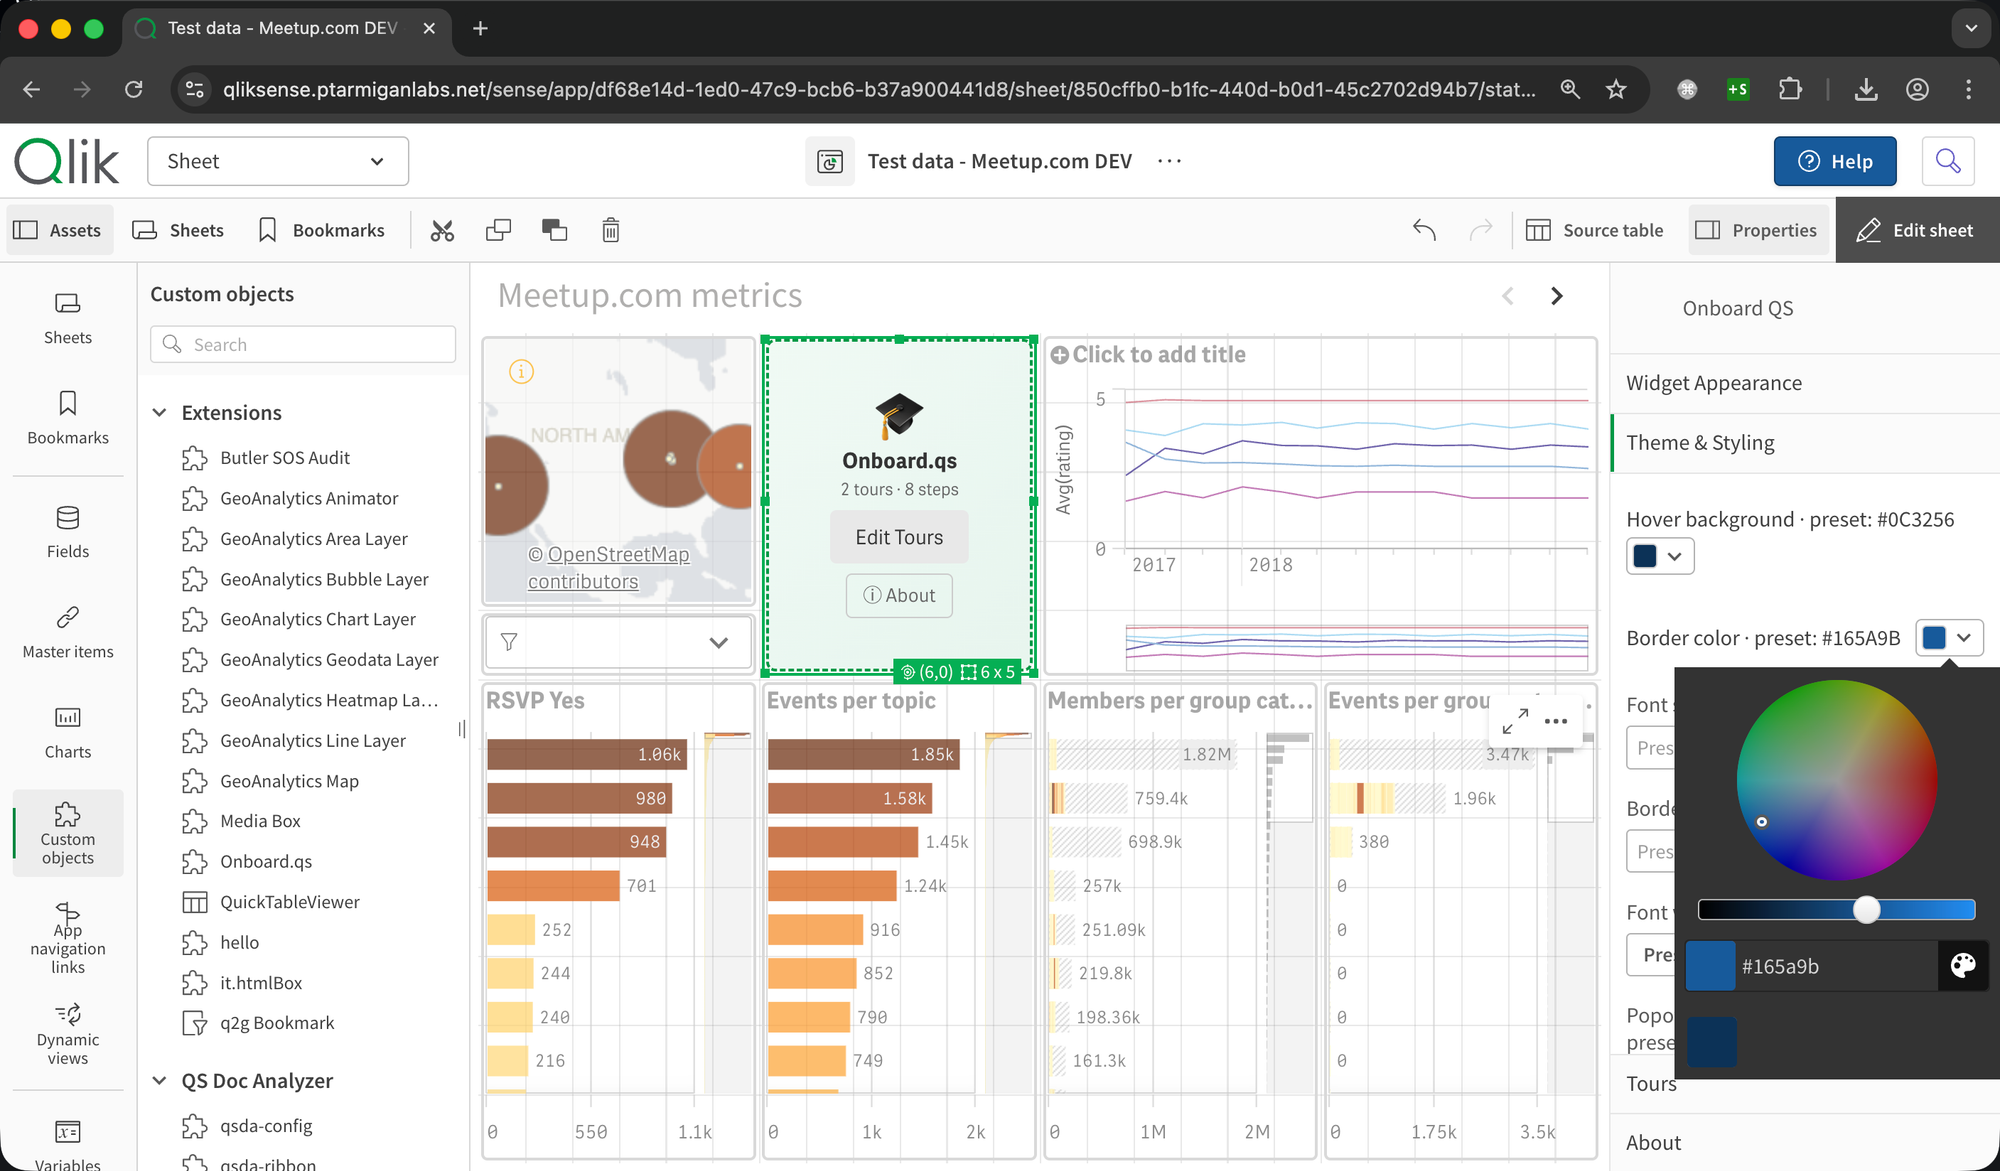
Theming and customisation
Onboard.qs ships with four built-in theme presets: Default, The Lean Green Machine, Corporate Blue, and Corporate Gold. Switching presets updates all colors instantly.
If the presets don't match your organisation's branding, every color is individually overridable using native Qlik color pickers — button backgrounds, text colors, hover states, popover backgrounds, progress indicators, dropdown menus.
Beyond colors, you can configure font family, font sizes, border radii, font weight, and several button styles. Horizontal and vertical alignment let you position the start button exactly where it makes sense on each sheet.
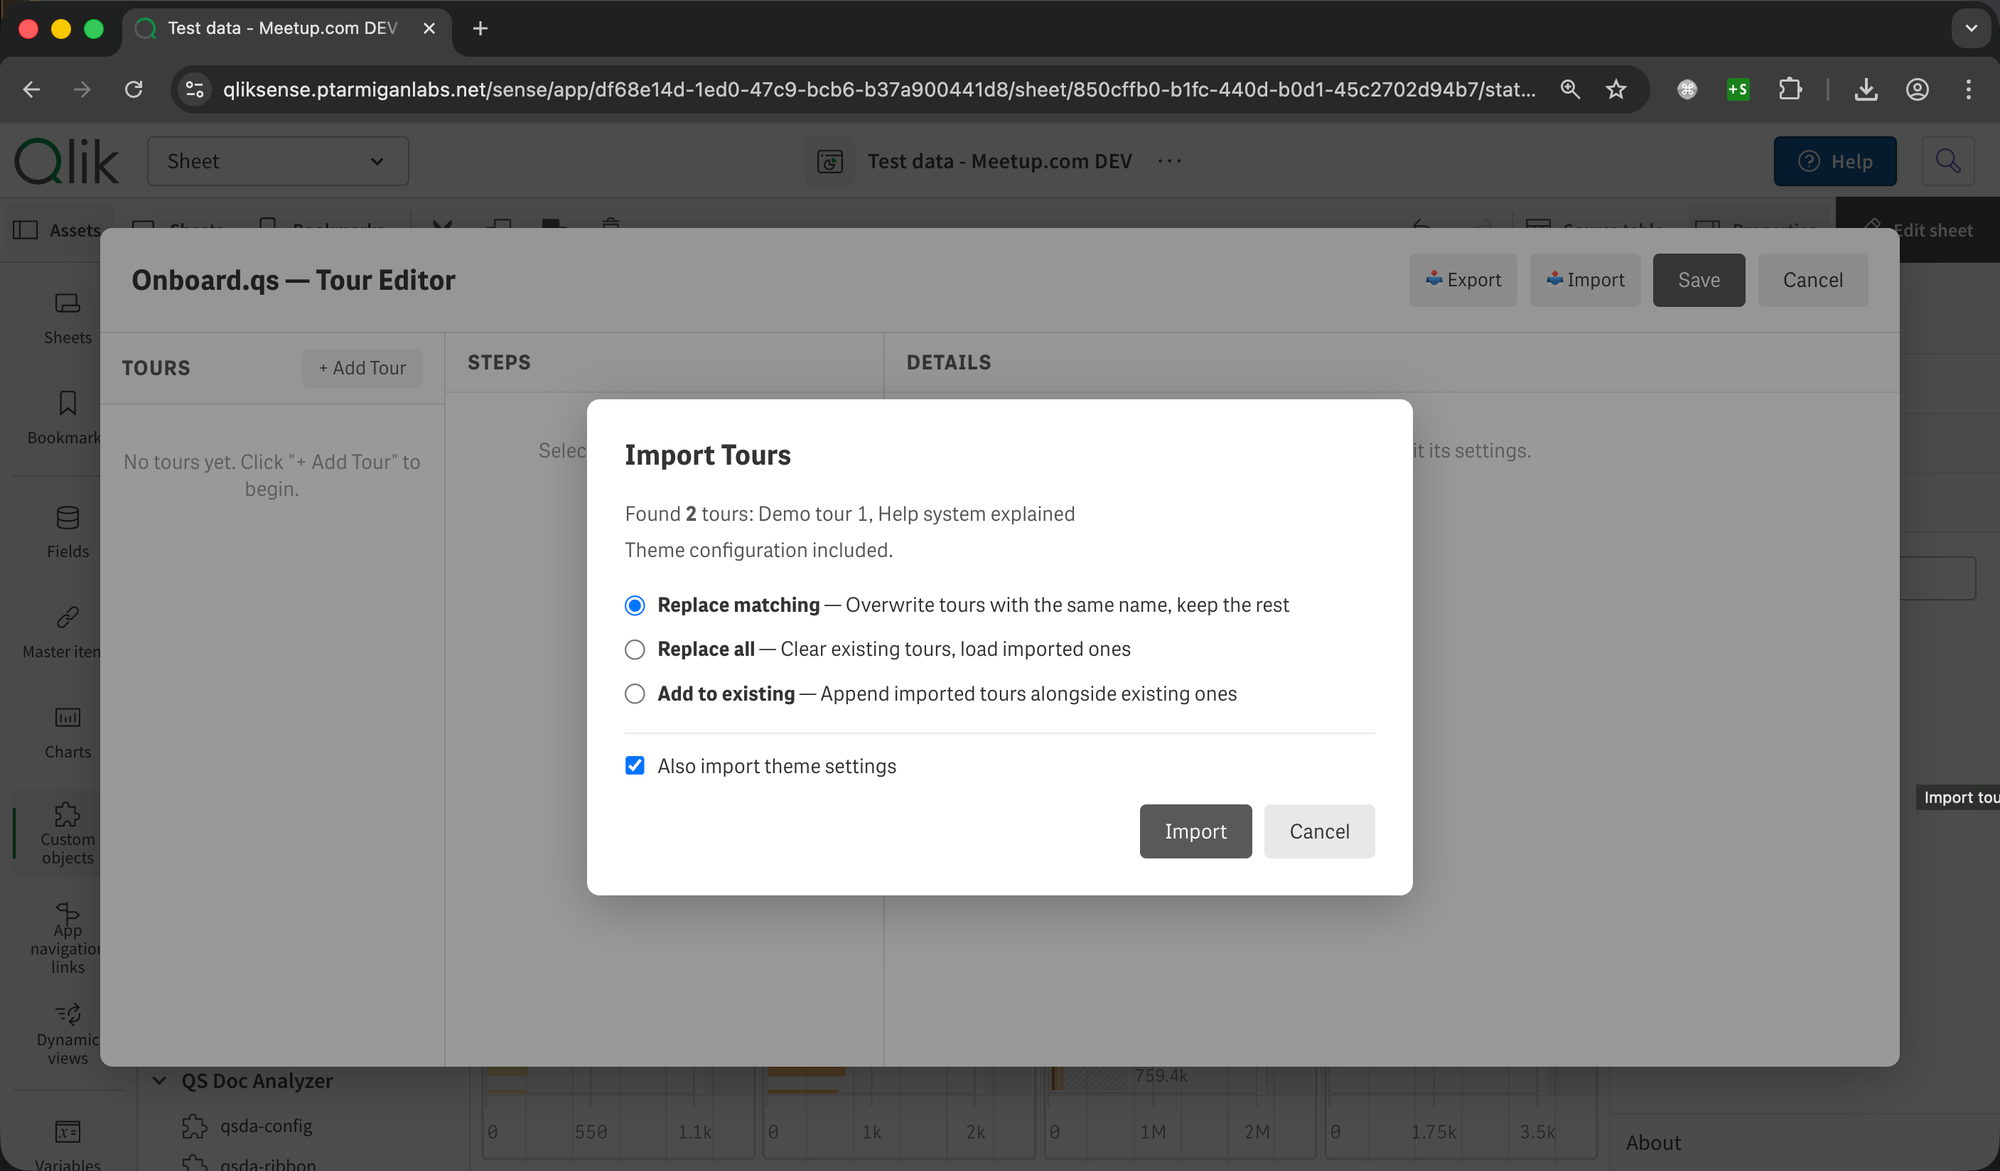
Tour import and export
Every tour configuration — tours, steps, theme settings, widget appearance — can be exported to a JSON file with a single click. Importing supports three merge modes:
| Merge mode | Behaviour |
|---|---|
| Replace Matching | Updates existing tours with matching IDs, keeps everything else |
| Replace All | Clears all existing tours and replaces with the imported set |
| Add to Existing | Appends imported tours alongside existing ones |
This enables practical workflows: build a tour in a development environment, export it, and import it into production. Share tour templates across apps. Back up configurations before making changes.
The end-user experience
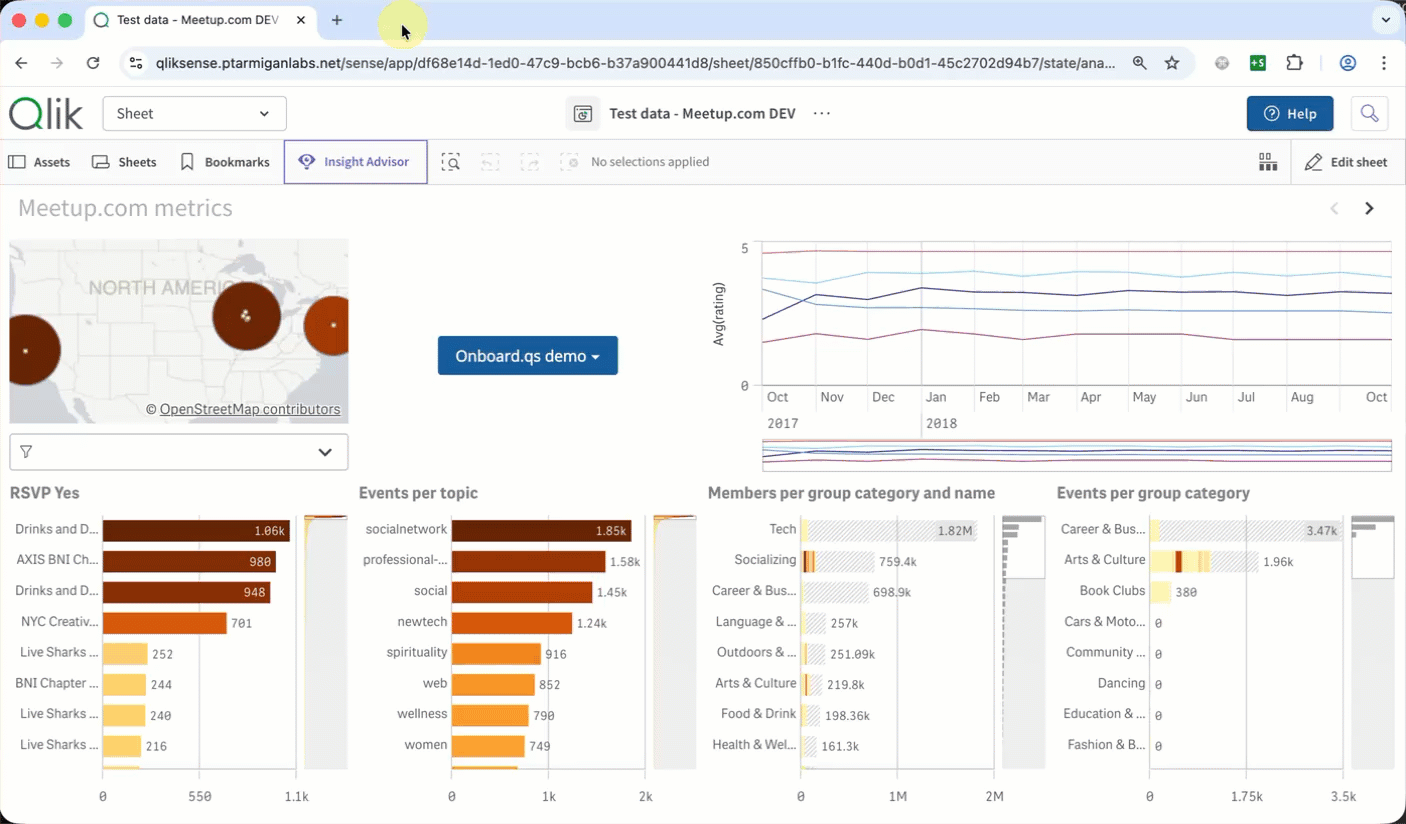
In analysis mode, users see a configurable button (or a dropdown if there are multiple tours). Clicking it launches a guided walkthrough that highlights one object at a time, displays a title and description, and provides Next / Previous / Done navigation.
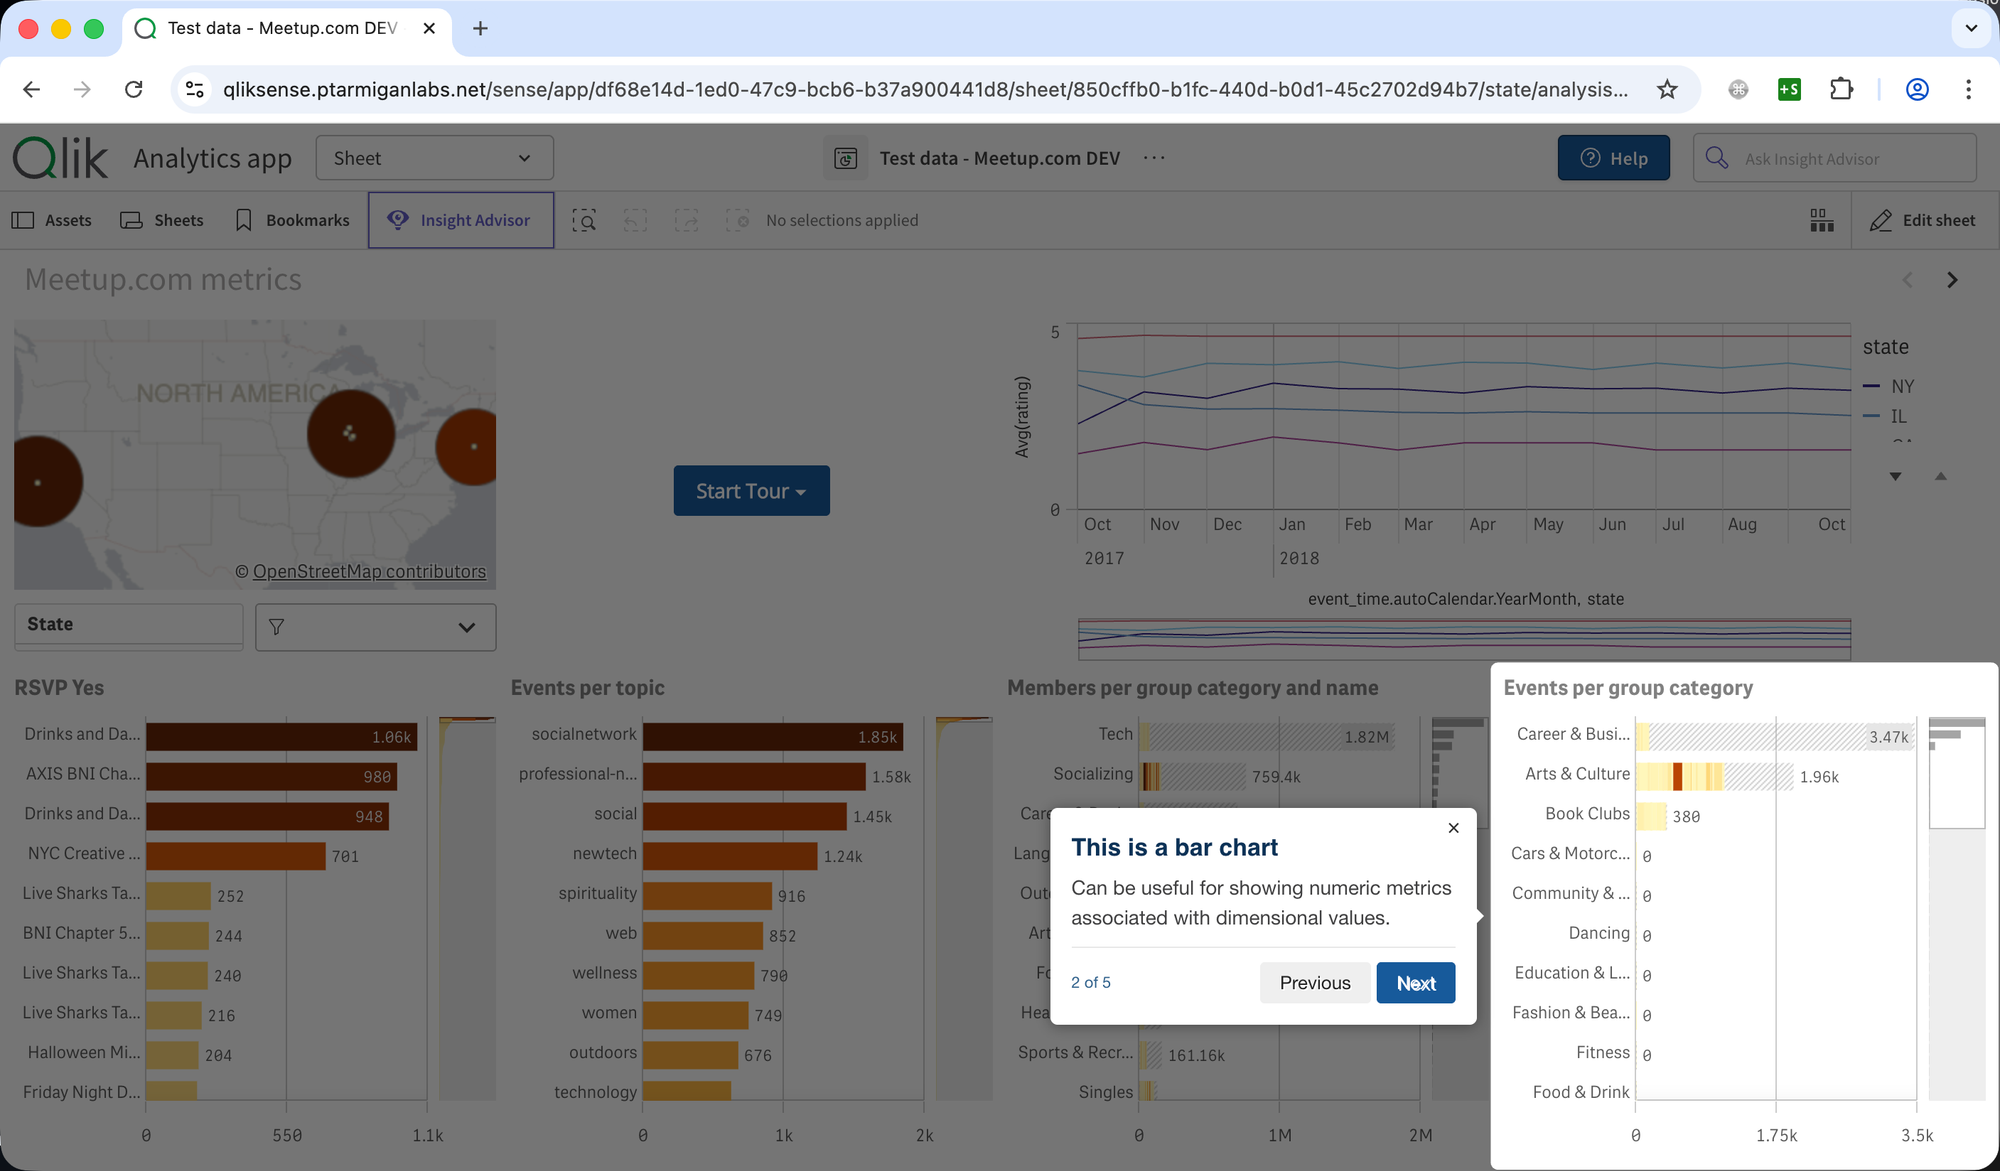
The overlay dims everything except the current target, drawing the user's attention exactly where it needs to be. Progress indicators show "Step 2 of 5," and keyboard navigation (arrow keys, Escape) works out of the box.
Lightweight and dependency-minimal
The production build is approximately 40 KB zipped. The only runtime dependency is driver.js (~5 KB gzip, included in the distributed extension) for the highlight and popover engine. Everything else — the tour editor, Markdown parser, platform detection, theme system — is custom code with zero external dependencies.
The Markdown parser is a purpose-built mini converter (~112 lines) that handles bold, italic, links, images, lists, blockquotes, headings, horizontal rules, and inline code — enough for rich tour content without pulling in a full Markdown library.
Getting started
Onboard.qs is available on GitHub:
Deployment is the same as any Qlik Sense extension:
Qlik Cloud: Upload onboard-qs.zip in the Management Console → Extensions, then drag the extension onto any sheet.
Client-managed (QSEoW): Import onboard-qs.zip via the QMC → Extensions, then drag onto any sheet.
The on-board.qs.zip file is found inside the zip file downloaded from GitHub's download page, so make sure to unzip that file first.
In addition to the extension zip, the downloaded file contains some getting-started info and similar.
Once placed on an app sheet, open the tour editor, create your first tour, and switch to analysis mode to see it in action.
Or do the same using the standard Sense property panels - the extension supports both workflows.
As with many other Ptarmigan Labs tools, onboard.qs is open source under the MIT license — free to use, modify, and share. If you find it useful, consider giving it a ⭐ on GitHub.