
Know thy Qlik Sense repository database
Two open source PowerShell scripts for read-only analysis of the Qlik Sense client-managed repository db — table sizes, health metrics, user and group membership insights, and group bloat detection. This helps optimizing the repo db and improve performance in the Qlik Sense environment.


We've spent the past 10 years developing open source tools that make life easier for Qlik Sense admins and developers.
If you are using and get value from them - please consider supporting our past, current and future work.
It can be a ★ on GitHub, or a financial contribution via GitHub's sponsorship program. It's just a couple of clicks away.
Not sure what tools exist? Easy - check here.
Want to be the first to get the latest SenseOps news in your inbox? Sign up at link below 👇.
Either way, you guys rock! 🙌
If you manage a medium or large client-managed Qlik Sense environment, questions about the repository database come up regularly (if it doesn't - it should...).
- How big is it?
- Which tables are growing?
- How old data is kept in it?
- How many users and groups are stored, and how much of that group data is actually useful - and how much is just AD/LDAP noise?
The repository database (QSR) is a PostgreSQL database, and while Qlik's QMC gives you some visibility, it doesn't expose raw database-level metrics.
Having that detailed insight is important when it comes to performance.
For example, if too much information is brought into Sense's user directory from whatever source is used (usually AD or LDAP) it can have a direct, negative impact on performance for all users.
Why? Because Sense will evaluate its security rules against all of those users and groups, even if only a handful of groups are actually used in rules. If you have 500 groups per user but only 5 are relevant to access control, that's a lot of noise that will slow down user syncs and rule evaluation.
Two new open source PowerShell scripts — repo-db-overview.ps1 and user-group-memberships.ps1 — connect directly to the QSR database and give you exactly that information, formatted as human-readable console output. They are read-only, carry no risk of modifying your environment, and work on PowerShell Core 6.0+ across Windows, macOS, and Linux.
Both scripts are part of the qs-toolbox-public repository on GitHub.
What you get at a glance: repo-db-overview.ps1
repo-db-overview.ps1 gives you a broad overview of the QSR database state. In summary mode (the default) it runs quickly using PostgreSQL's built-in statistics tables — no expensive queries.
Here's what actual summary output looks like:
================================================================================
Qlik Sense Repository Database - Overview
================================================================================

Connection Information:
  Host:       192.168.x.x
  Port:       4432
  Database:   QSR
  User:       postgres

Database Statistics:
  Total Size:    180 MB (188 932 899 bytes)
  Tables:        164
  Users:         16

================================================================================
Qlik Sense Repository Database - Table Statistics
================================================================================

Total Tables: 164

Table Summary (sorted by size, largest first):
--------------------------------------------------------------------------------

Table Name                                               Row Count Table Size Indexes
                                                                               Size
----------                                               --------- ---------- -------
public.FileReferences                                    158 060   41 MB      6 704 kB
public.ExecutionResultDetailExecutionResults             148 824   9 544 kB   20 MB
public.ExecutionResultDetails                            148 824   21 MB      6 176 kB
public.ExecutionResults                                  49 421    11 MB      3 336 kB
public.AppObjects                                        16 096    10 MB      2 040 kB
public._deletedentitylog                                 3 485     3 616 kB   5 456 kB
public.StaticContentReferences                           5 725     2 112 kB   376 kB
public.Apps                                              454       168 kB     64 kB
public.Extensions                                        83        16 kB      64 kB
public.Users                                             185       40 kB      32 kB
...
The biggest driver of size in this environment is FileReferences at 41 MB. Reload execution history (ExecutionResults and related tables) takes up another ~40 MB combined. For a 180 MB total database, this is a modest size — but knowing the breakdown lets you plan maintenance and anticipate growth.
The report also lists all 16 database roles and their permissions — useful for auditing which accounts have superuser or replication rights.
Detailed mode with exact row counts
Add -DetailLevel details to run exact COUNT(*) queries on the largest tables. This takes more time and puts slightly more load on the database, so save it for maintenance windows. A safeguard limits exact counts to 10 tables by default (configurable with -MaxExactCountTables), and each count query has a 60-second timeout.
.\script\repo-db-overview.ps1 -DetailLevel details
User group membership analysis: user-group-memberships.ps1
user-group-memberships.ps1 focuses on a specific operational question: which users are in the repository, how many group memberships do they have, and is the group data clean and useful?
Group membership data in QSR usually comes from Active Directory or LDAP synchronisation. In many environments, the sync pulls in far more groups than Qlik Sense actually uses for access control — groups like Domain Users, Denied RODC Password Replication Group, or other AD defaults end up stored alongside the handful of groups that are actually referenced in security rules. Over time this adds noise to the repository and makes user management harder to reason about.
The script makes this visible.
Here's sample summary output:
================================================================================
Qlik Sense Repository - User Group Memberships
================================================================================

Connection Information:
  Host:       192.168.x.x
  Port:       4432
  Database:   QSR
  User:       postgres

--------------------------------------------------------------------------------
Summary Statistics:
--------------------------------------------------------------------------------

  Total Users:              185
  Users with Groups:        30
  Users without Groups:     155
  Total Group Memberships:  60
  Distinct Groups:          13

  Avg Groups per User:      0.32
  Min Groups per User:      0
  Max Groups per User:      9

--------------------------------------------------------------------------------
Table Storage:
--------------------------------------------------------------------------------

  Users:
    Rows:       185
    Size:       112 kB (114 688 bytes)
  UserAttributes:
    Rows:       62
    Size:       80 kB (81 920 bytes)

--------------------------------------------------------------------------------
Distribution: Users by Number of Group Memberships
--------------------------------------------------------------------------------

  Groups      Users       %  Bar
  -------------------------------------------------------------------
  0 groups      155   83,8%  ########################################
  1 group        24   13,0%  ######
  3 groups        2    1,1%  #
  6 groups        2    1,1%  #
  9 groups        2    1,1%  #


--------------------------------------------------------------------------------
Top 10 Users by Group Count:
--------------------------------------------------------------------------------

User Directory User ID       Name                 Group Count
-------------- -------       ----                 -----------
CORP           jdoe          Jane Doe             9
DEV            jdoe          Jane Doe             9
DEV            administrator Administrator        6
CORP           administrator Administrator        6
DEV            qlikservice   Qlik service account 3
CORP           qlikservice   Qlik service account 3
CORP           testuser_8    Testuser8            1
...


--------------------------------------------------------------------------------
Top 10 Groups by User Count:
--------------------------------------------------------------------------------

Group Name                             User Count
----------                             ----------
sense-demo-ext                         22
Denied RODC Password Replication Group 8
Administrators                         6
Domain Admins                          4
Schema Admins                          4
...
Already instructive: in this environment, 155 out of 185 users have zero group memberships. Of the 13 distinct groups in the repository, only one (sense-demo-ext) has more than 8 members. The distribution histogram makes the shape of your data immediately visible.
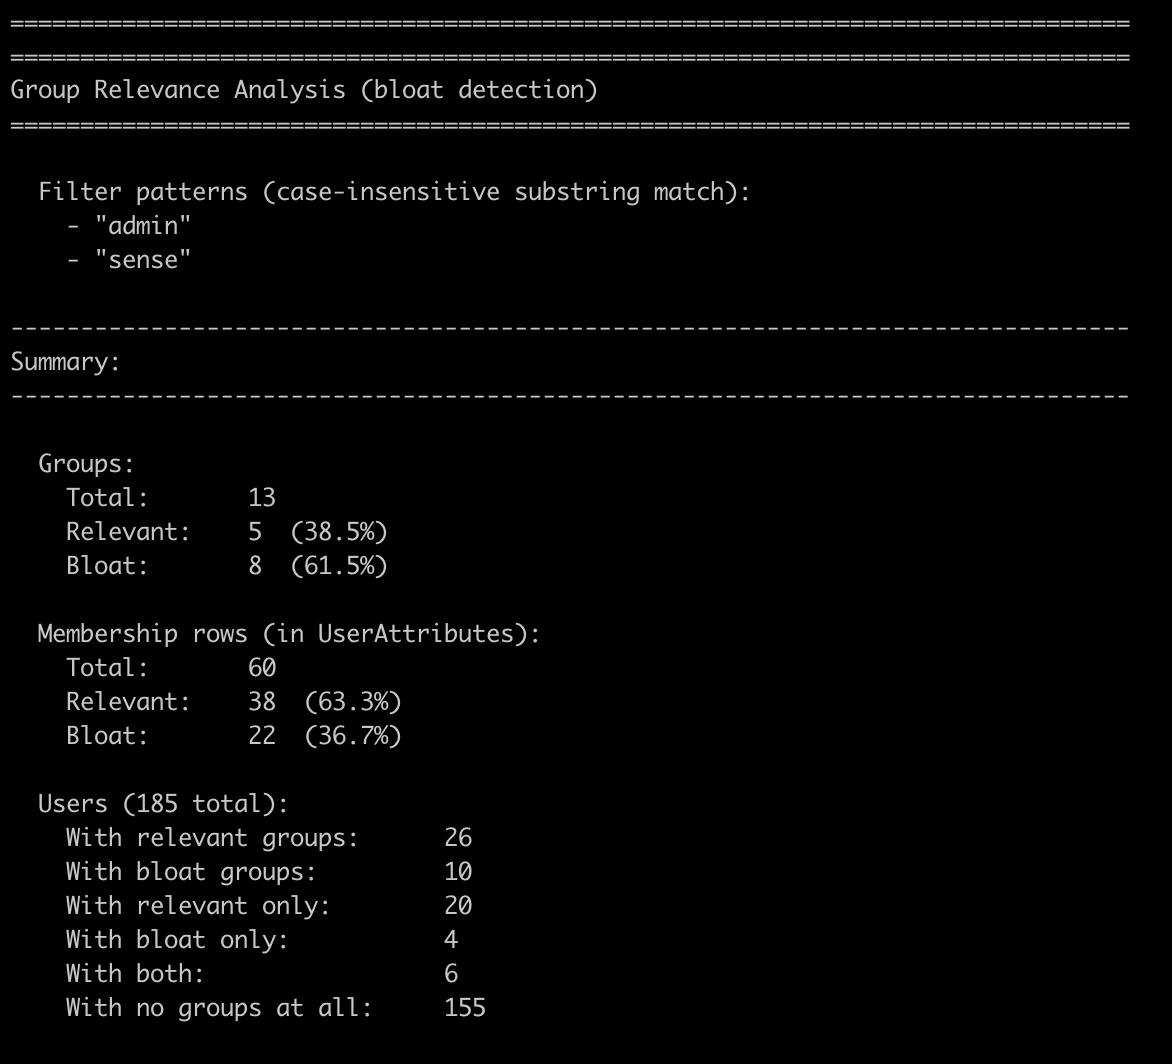
Group bloat detection with -RelevantGroups
The most operationally useful feature of user-group-memberships.ps1 is the -RelevantGroups parameter. It lets you classify every group in the repository as relevant or bloat based on one or more case-insensitive substring patterns.
The idea: you know which groups your Qlik Sense security rules actually use. Pass those name patterns as comma-separated substrings, and the script tells you how much of the stored group data is actually meaningful — and how much is AD noise.
.\script\user-group-memberships.ps1 -RelevantGroups "sense,qlik"
The analysis section appended to the standard summary:
================================================================================
Group Relevance Analysis (bloat detection)
================================================================================

  Filter patterns (case-insensitive substring match):
    - "sense"
    - "qlik"

--------------------------------------------------------------------------------
Summary:
--------------------------------------------------------------------------------

  Groups:
    Total:       13
    Relevant:    1  (7.7%)
    Bloat:       12  (92.3%)

  Membership rows (in UserAttributes):
    Total:       60
    Relevant:    22  (36.7%)
    Bloat:       38  (63.3%)

  Users (185 total):
    With relevant groups:      22
    With bloat groups:         10
    With relevant only:        20
    With bloat only:           8
    With both:                 2
    With no groups at all:     155

--------------------------------------------------------------------------------
Relevant Groups (1):
--------------------------------------------------------------------------------

Group Name     User Count
----------     ----------
sense-demo-ext 22


--------------------------------------------------------------------------------
Bloat Groups (12):
--------------------------------------------------------------------------------

Group Name                             User Count
----------                             ----------
Denied RODC Password Replication Group 8
Administrators                         6
Domain Admins                          4
Schema Admins                          4
Domain Users                           2
Enterprise Admins                      2
Group Policy Creator Owners            2
grp_1_1                                2
grp_1_2                                2
grp_2_1                                2
Guests                                 2
Users                                  2


--------------------------------------------------------------------------------
Membership Row Composition:
--------------------------------------------------------------------------------

  [RRRRRRRRRRRRRRRxxxxxxxxxxxxxxxxxxxxxxxxx]
  R = Relevant (36.7%)    x = Bloat (63.3%)
In this test environment, 12 of 13 groups — representing 63.3% of all stored membership rows — are classified as bloat under the sense,qlik patterns. That's a concrete, actionable number. If the same were true in a production system with thousands of users, you'd know exactly where to direct a cleanup effort or a conversation with your AD team about refining the UDC sync configuration.
The bloat percentage is based on membership rows (user–group pairs), not just group counts. A group with 200 members weighs far more than a group with 2.
Additional modes: filter, list, export
Both scripts support a handful of additional modes worth knowing about:
-ListUsers— list all users with their group counts (sorted descending)-ListGroups— list all groups with their member counts-FilterUser 'DOMAIN\userId'— full group membership detail for a specific user-FilterGroup 'Group Name'— full member list for a specific group-OutputFile report.txt— write the full report to a timestamped file
These are handy during investigations. If you're trying to work out why a user can or can't access a specific Qlik Sense stream, -FilterUser gives you their complete group membership list in one command.
Requirements and getting started
The scripts have minimal requirements:
- PowerShell Core 6.0+ — works on Windows, macOS, and Linux
psqlclient (PostgreSQL 12+) — the scripts callpsqlfor all database queries- Network access to the PostgreSQL host on the configured port (default: 4432)
Configuration is via environment variables or command-line parameters:
$env:QSR_DB_HOST     = 'qlik-sense-server.example.local'
$env:QSR_DB_PORT     = '4432'
$env:QSR_DB_NAME     = 'QSR'
$env:QSR_DB_USER     = 'postgres'
$env:QSR_DB_PASSWORD = 'your-password'

# Run the DB overview
.\script\repo-db-overview.ps1

# Run the user/group analysis
.\script\user-group-memberships.ps1

# Run bloat detection
.\script\user-group-memberships.ps1 -RelevantGroups 'sense,admin'
All scripts are read-only. They do not write to or modify the QSR database. Running them in summary mode (the default) has minimal performance impact; detailed mode with COUNT(*) queries is best kept for maintenance windows.
The scripts include a psql connectivity check at startup and will exit cleanly with a descriptive error if the database is unreachable or the user lacks the necessary permissions.
Where to get the scripts
The scripts are free and open source under the MIT license, available in the qs-toolbox-public repository on GitHub:
qs-toolbox-public/
└── client-managed/
    └── powershell/
        └── repo-db-optimize/
            ├── README.md
            ├── script/
            │   ├── repo-db-overview.ps1
            │   └── user-group-memberships.ps1
            └── docs/
                ├── repo-db-overview.md
                └── user-group-memberships.md
Full documentation for each script is in the docs/ folder. The README.md covers environment variables, all parameters, step-by-step debug mode, and troubleshooting.
If you're managing a client-managed Qlik Sense environment and want a clearer picture of your repository database, clone the repo and give them a run. All feedback welcome via GitHub issues!
And as always, if you find the scripts useful, please consider giving the repository a star on GitHub — it helps us understand community interest and guides future development.