
Profiling Qlik QVD files in VS Code
Analyze QVD field distributions directly in VS Code with Ctrl-Q QVD Viewer's new profiling feature. Get interactive charts, statistical analysis, histograms for numeric fields, and export results as Qlik .qvs scripts

When working with QVD files in Qlik Sense, you often need to understand what's actually inside them before deciding how to use them in your applications.
- What values are in that dimension field?
- How are they distributed?
- Are there data quality issues lurking in there?
Version 1.2 of Ctrl-Q QVD Viewer for Visual Studio Code brings a new capability that answers these questions: Data Profiling
This feature lets you analyze value distributions, understand field characteristics, and identify patterns—all without opening Qlik Sense or QlikView.
Right - sooner or later you will need to dive into Sense, but understanding what's actually inside QVDs can save lots of time.
This version of the extension also supports older VS Code versions (1.100.0 and later), ensuring a wider range of compatibility than before.
What Is Data Profiling?
Data profiling analyzes the content of your QVD fields to show frequency distributions and statistical characteristics.
Think of it as getting a field-level view into your data: which values appear most often, how many unique values exist, whether there are NULLs or outliers, and for numeric fields, comprehensive statistical metrics.
This is particularly valuable when working with dimensional data in star-schema models. Before loading a customer dimension or product catalog into your app, you can quickly understand the distribution of customer types, product categories, or regional breakdowns.
How to Use Data Profiling
The profiling feature is straightforward to use.
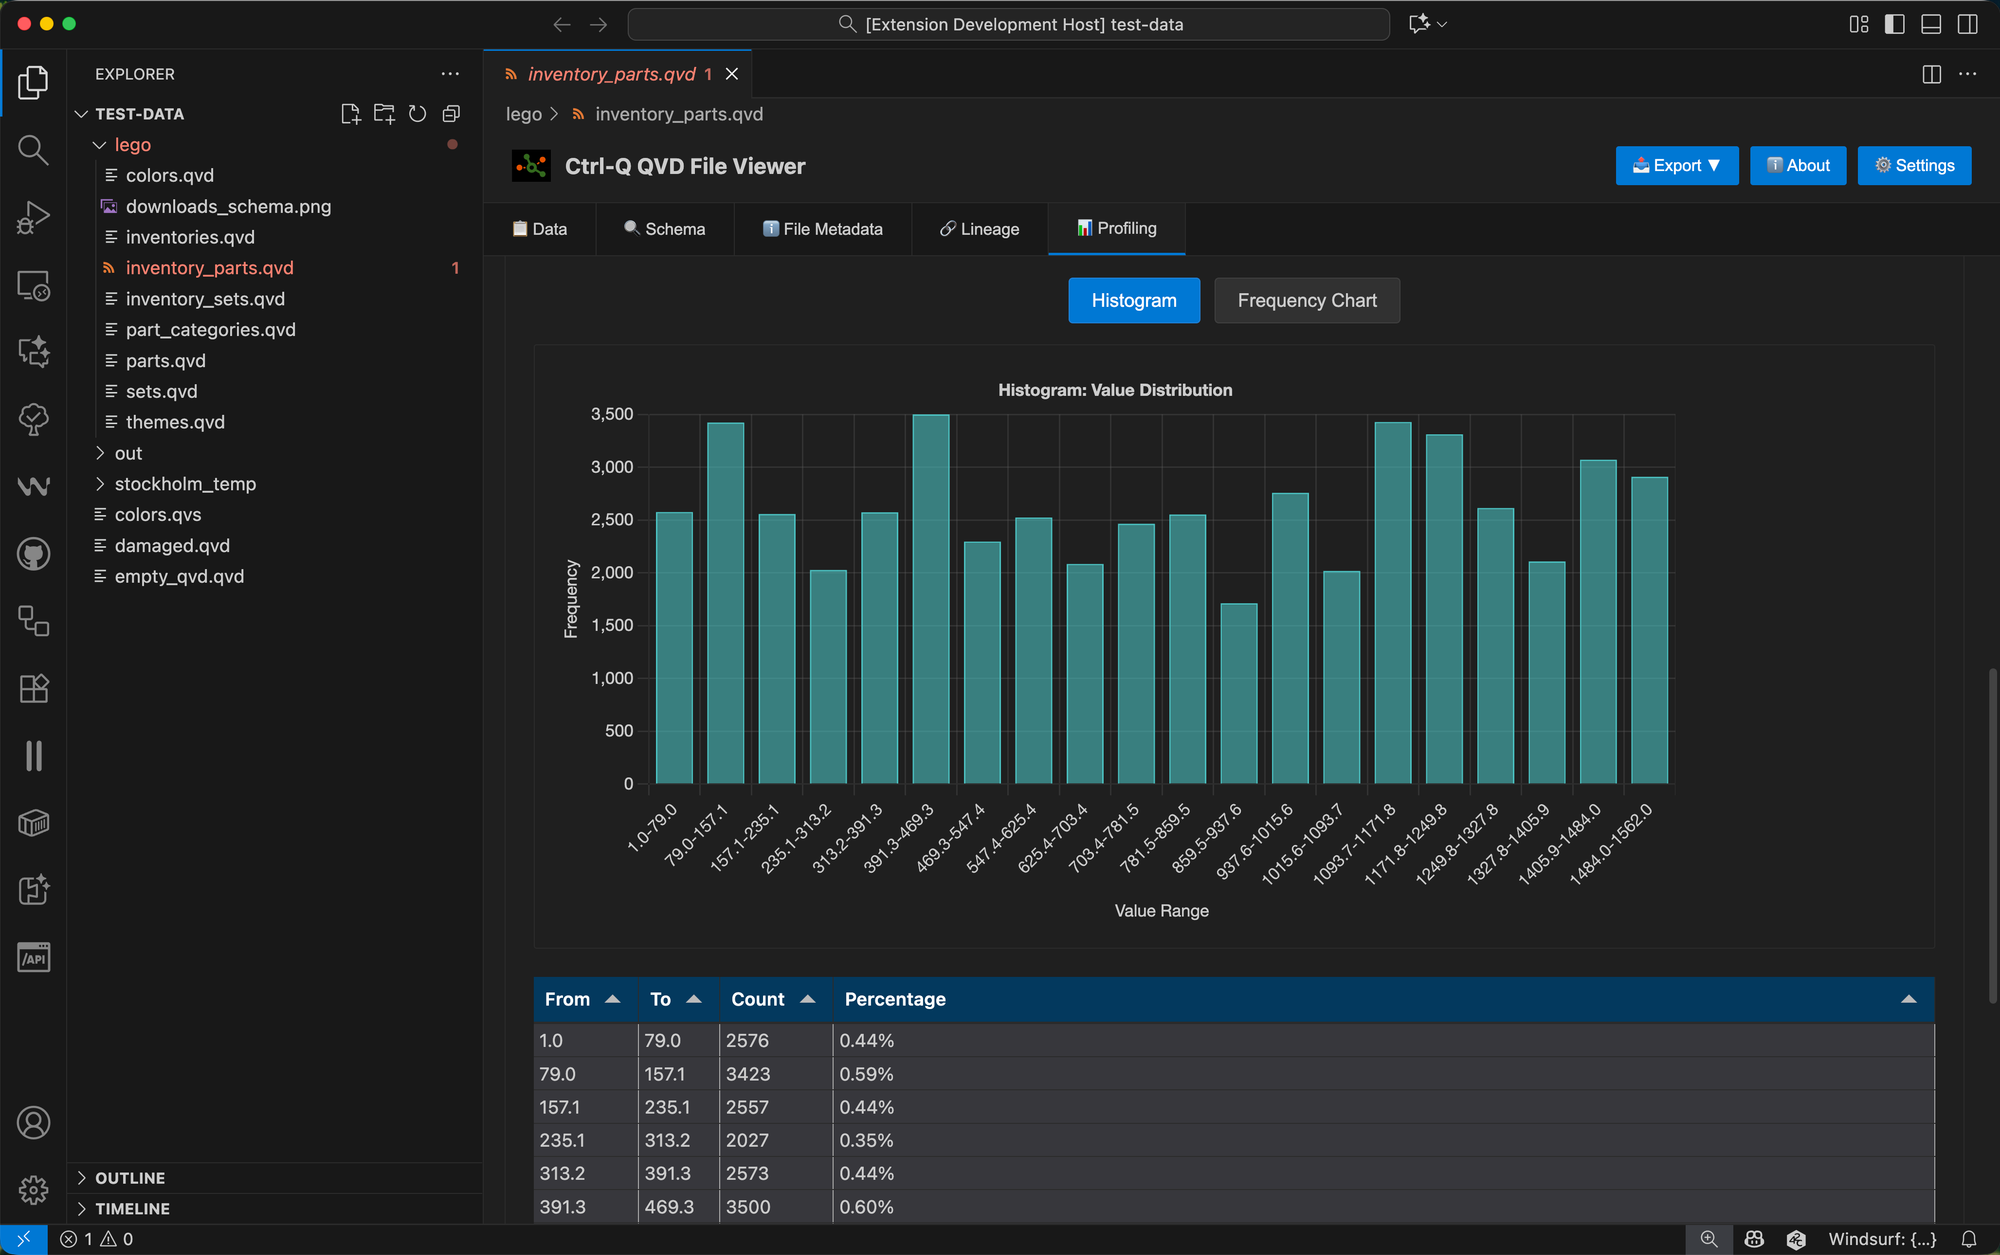
Open any QVD file in VS Code with the Ctrl-Q QVD Viewer extension, then navigate to the 📊 Profiling tab.
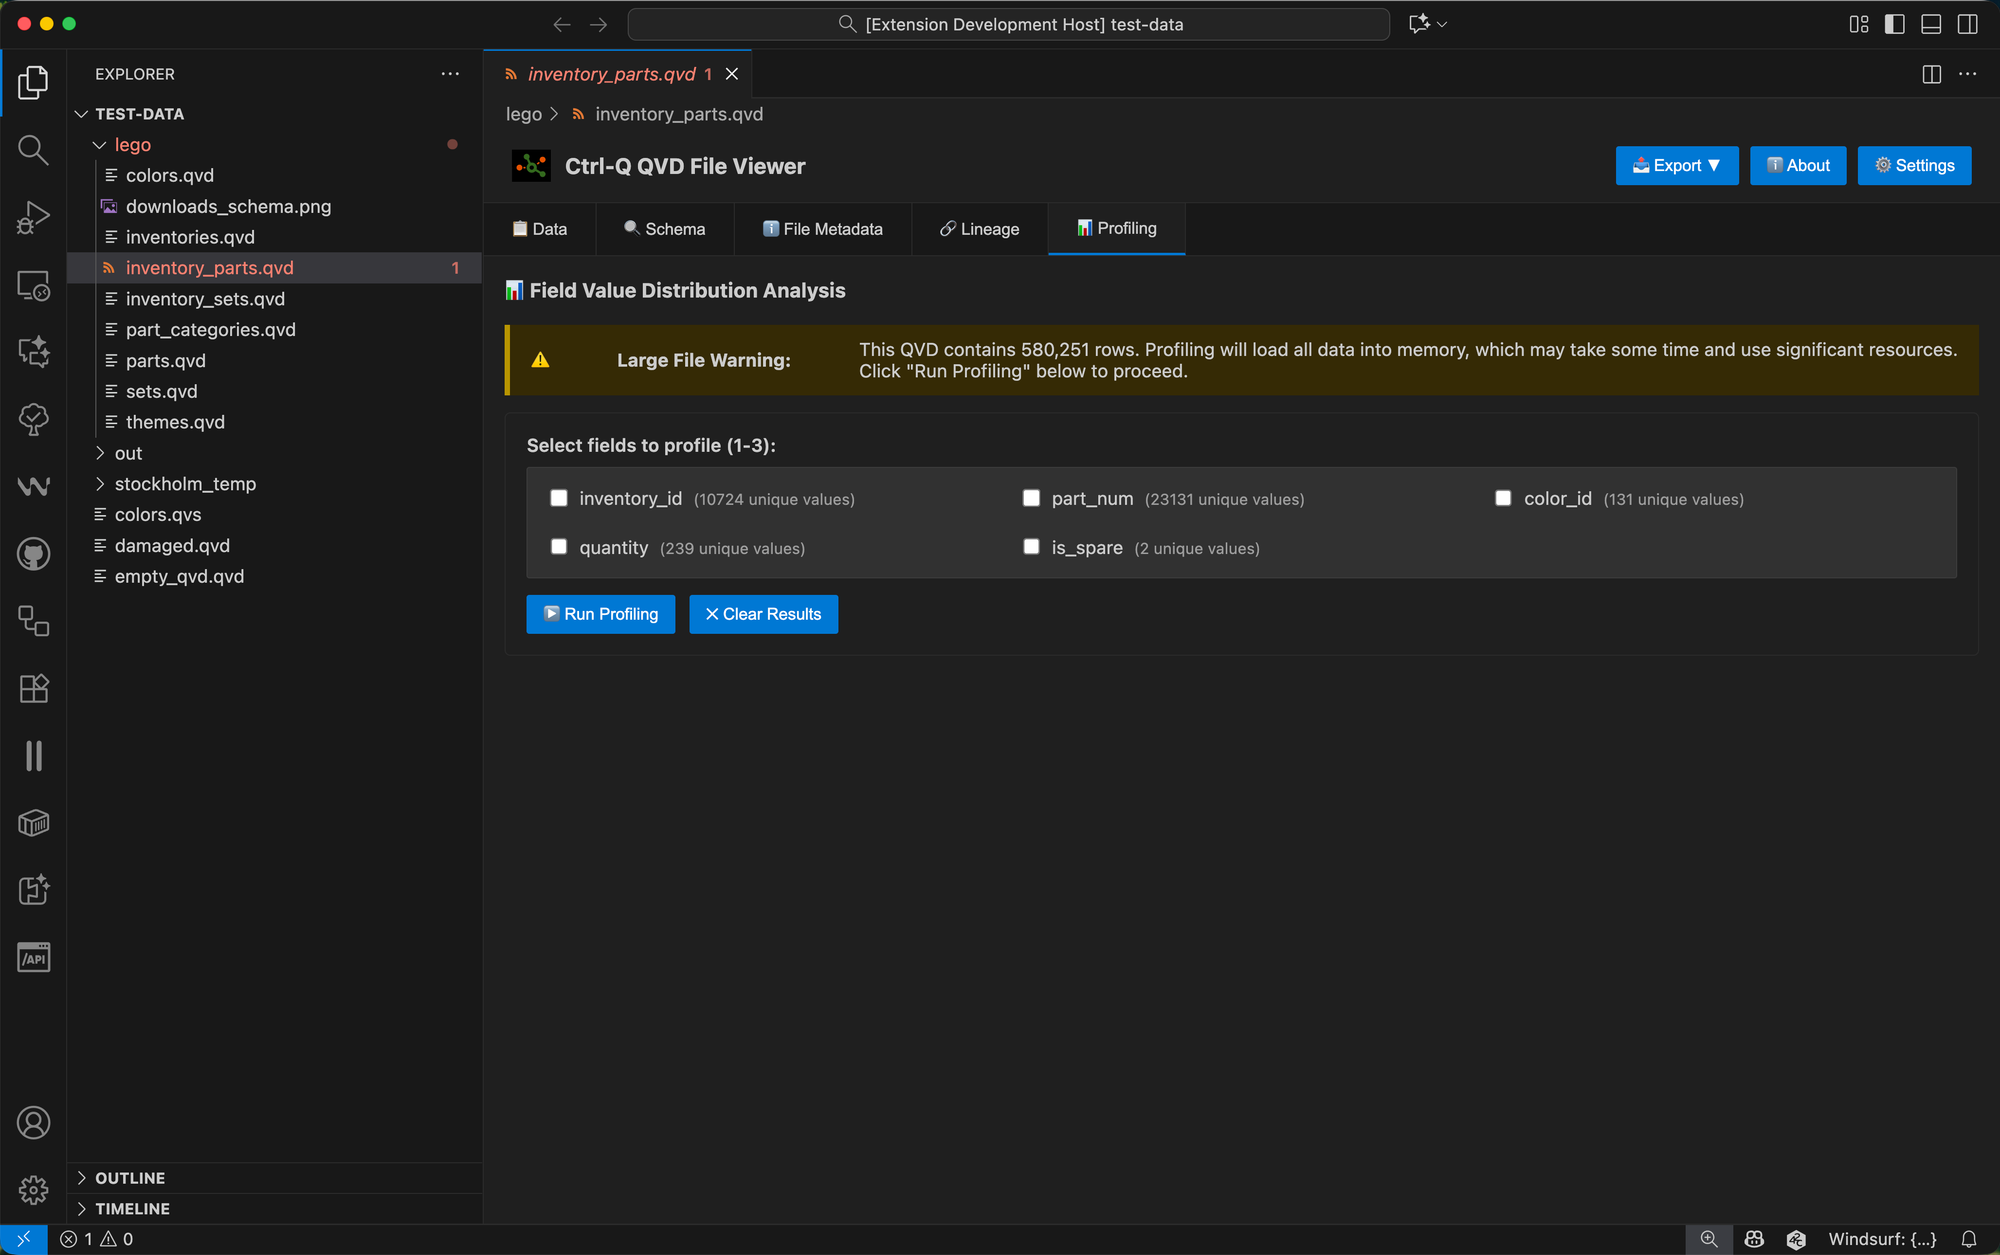
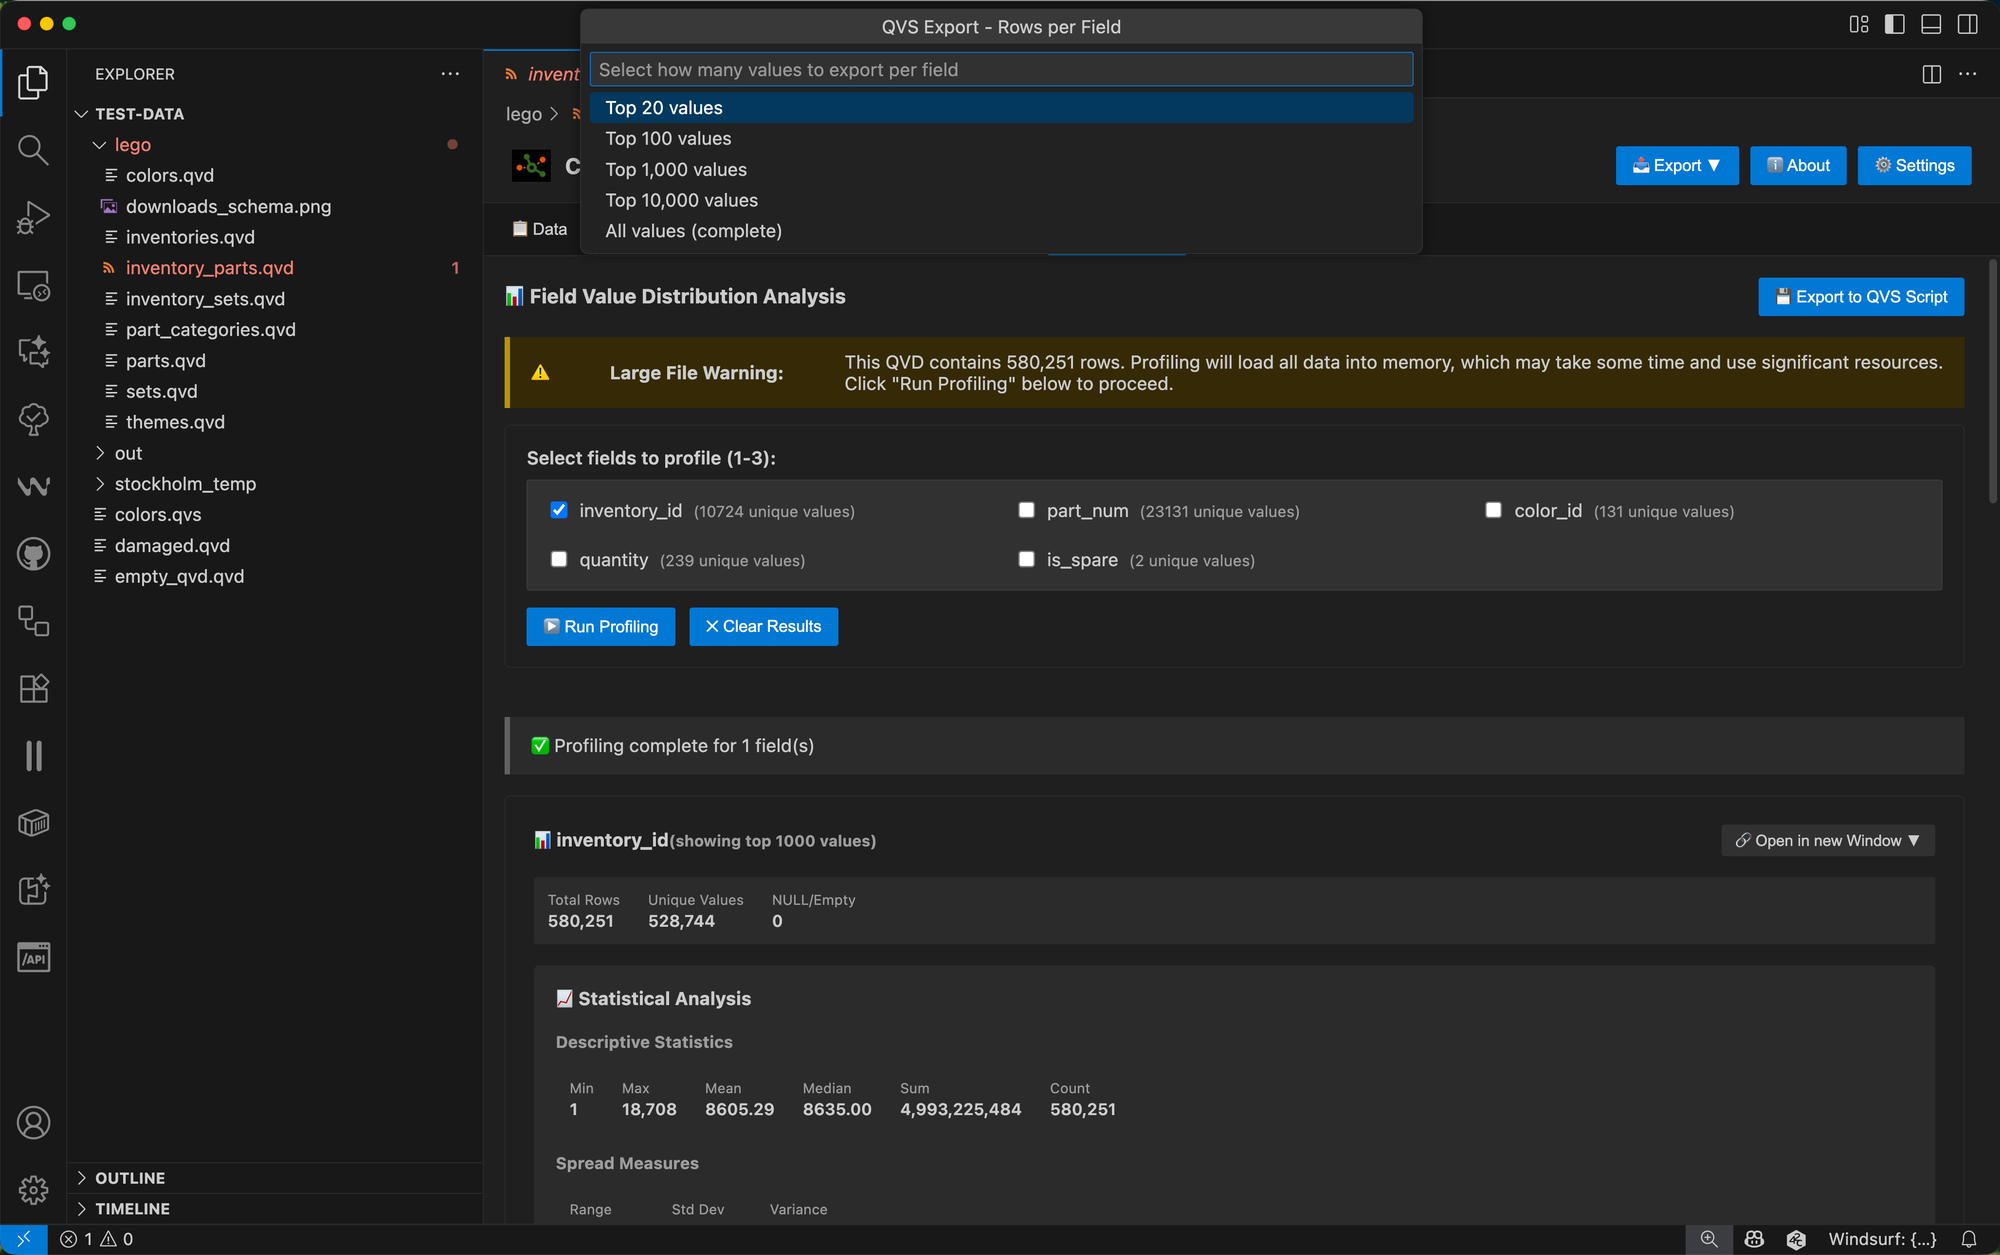
You'll see a grid of checkboxes representing all fields in your QVD, along with their unique value counts.
Select between 1 and 3 fields — the ability to compare multiple fields side-by-side is one of the feature's strengths — then click ▶️ Run Profiling.
For large QVD files (more than 100,000 rows), you'll receive a warning before profiling begins. This is because profiling loads all data into memory to compute accurate distributions, so it's good to be aware of potential performance impacts.
What You'll See: Visual Frequency Analysis
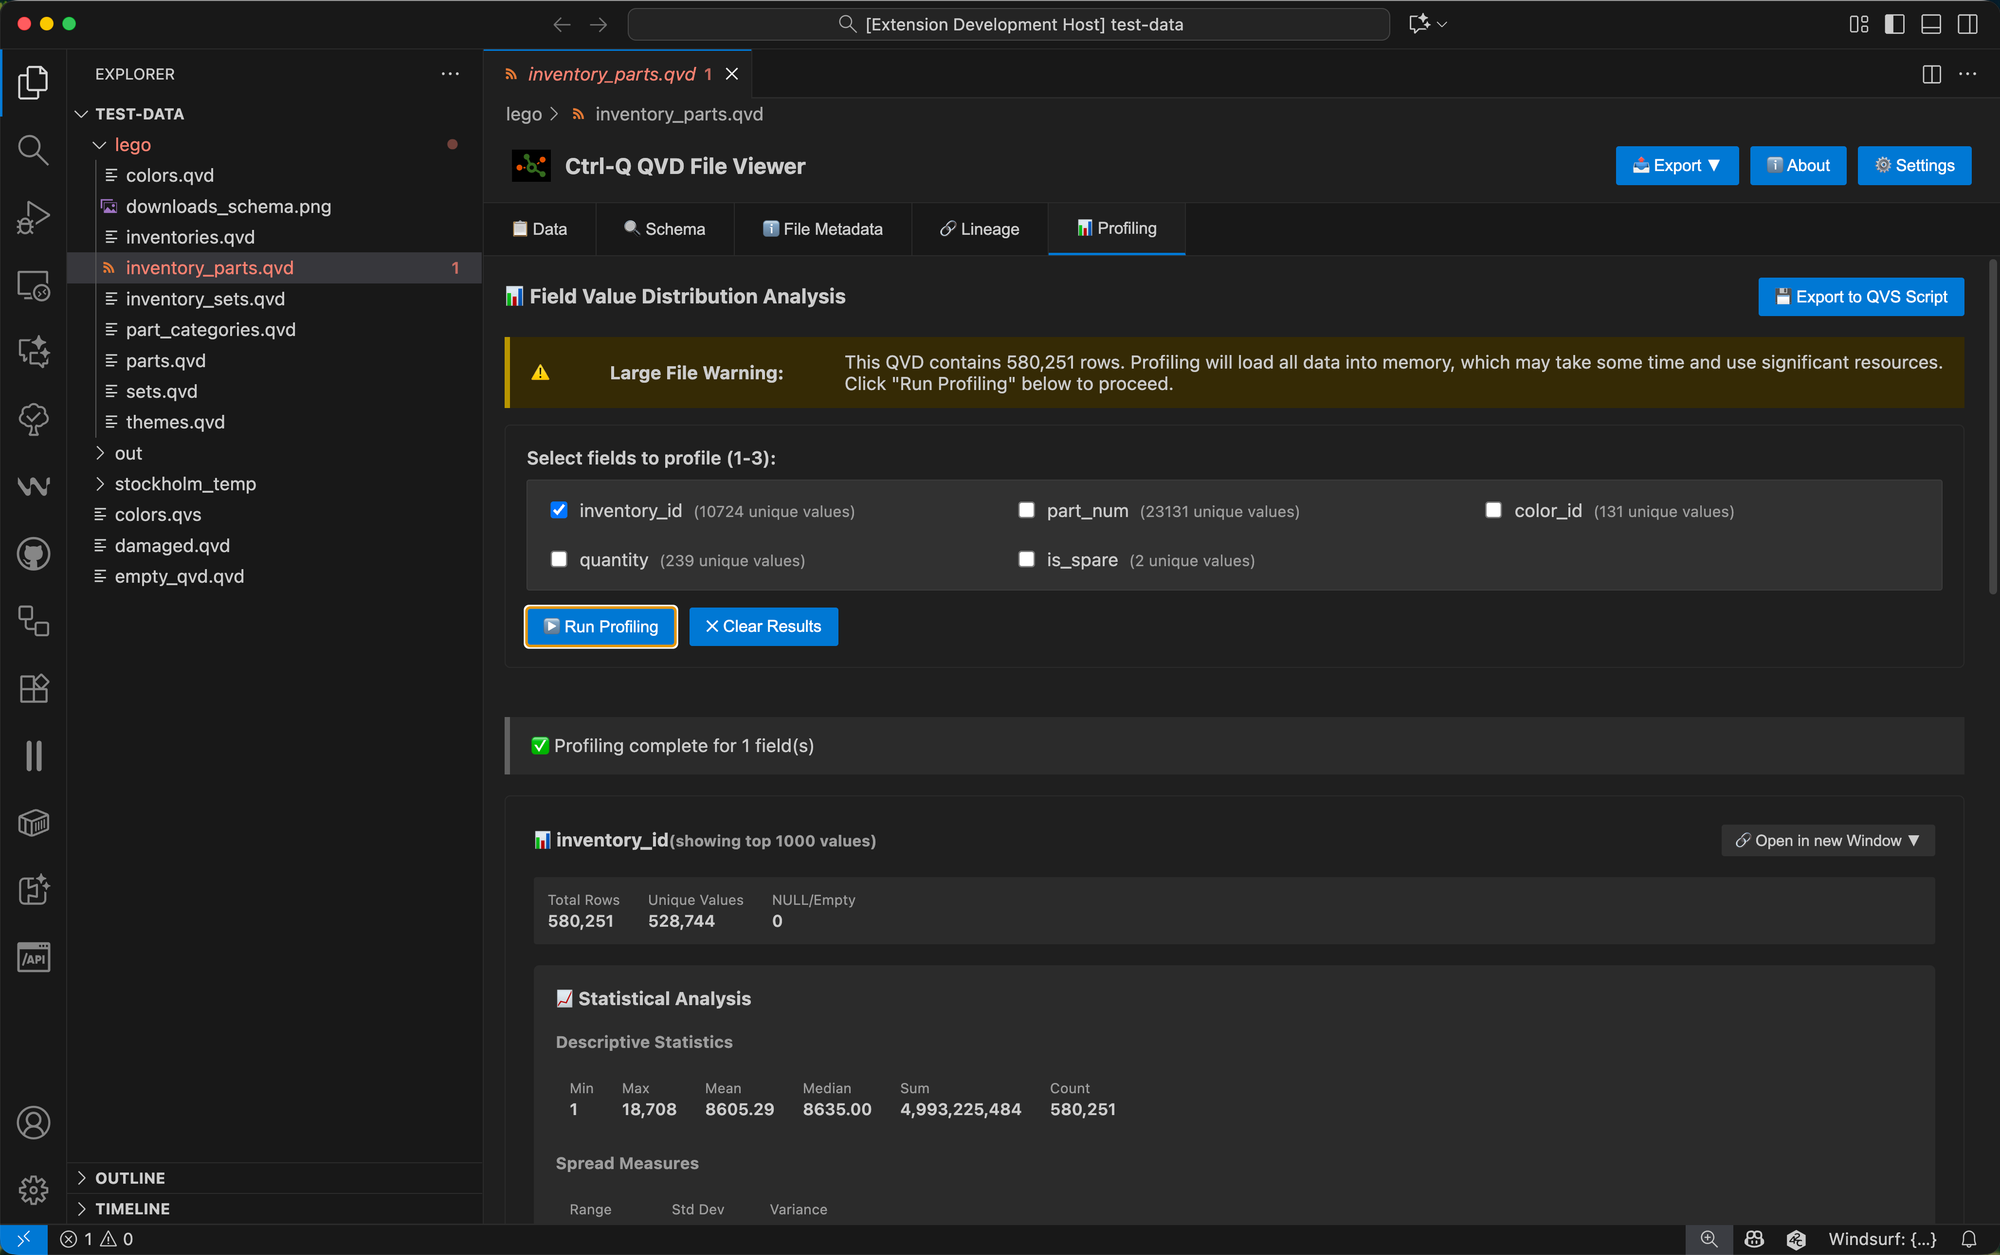
After profiling completes, you get results for each selected field.
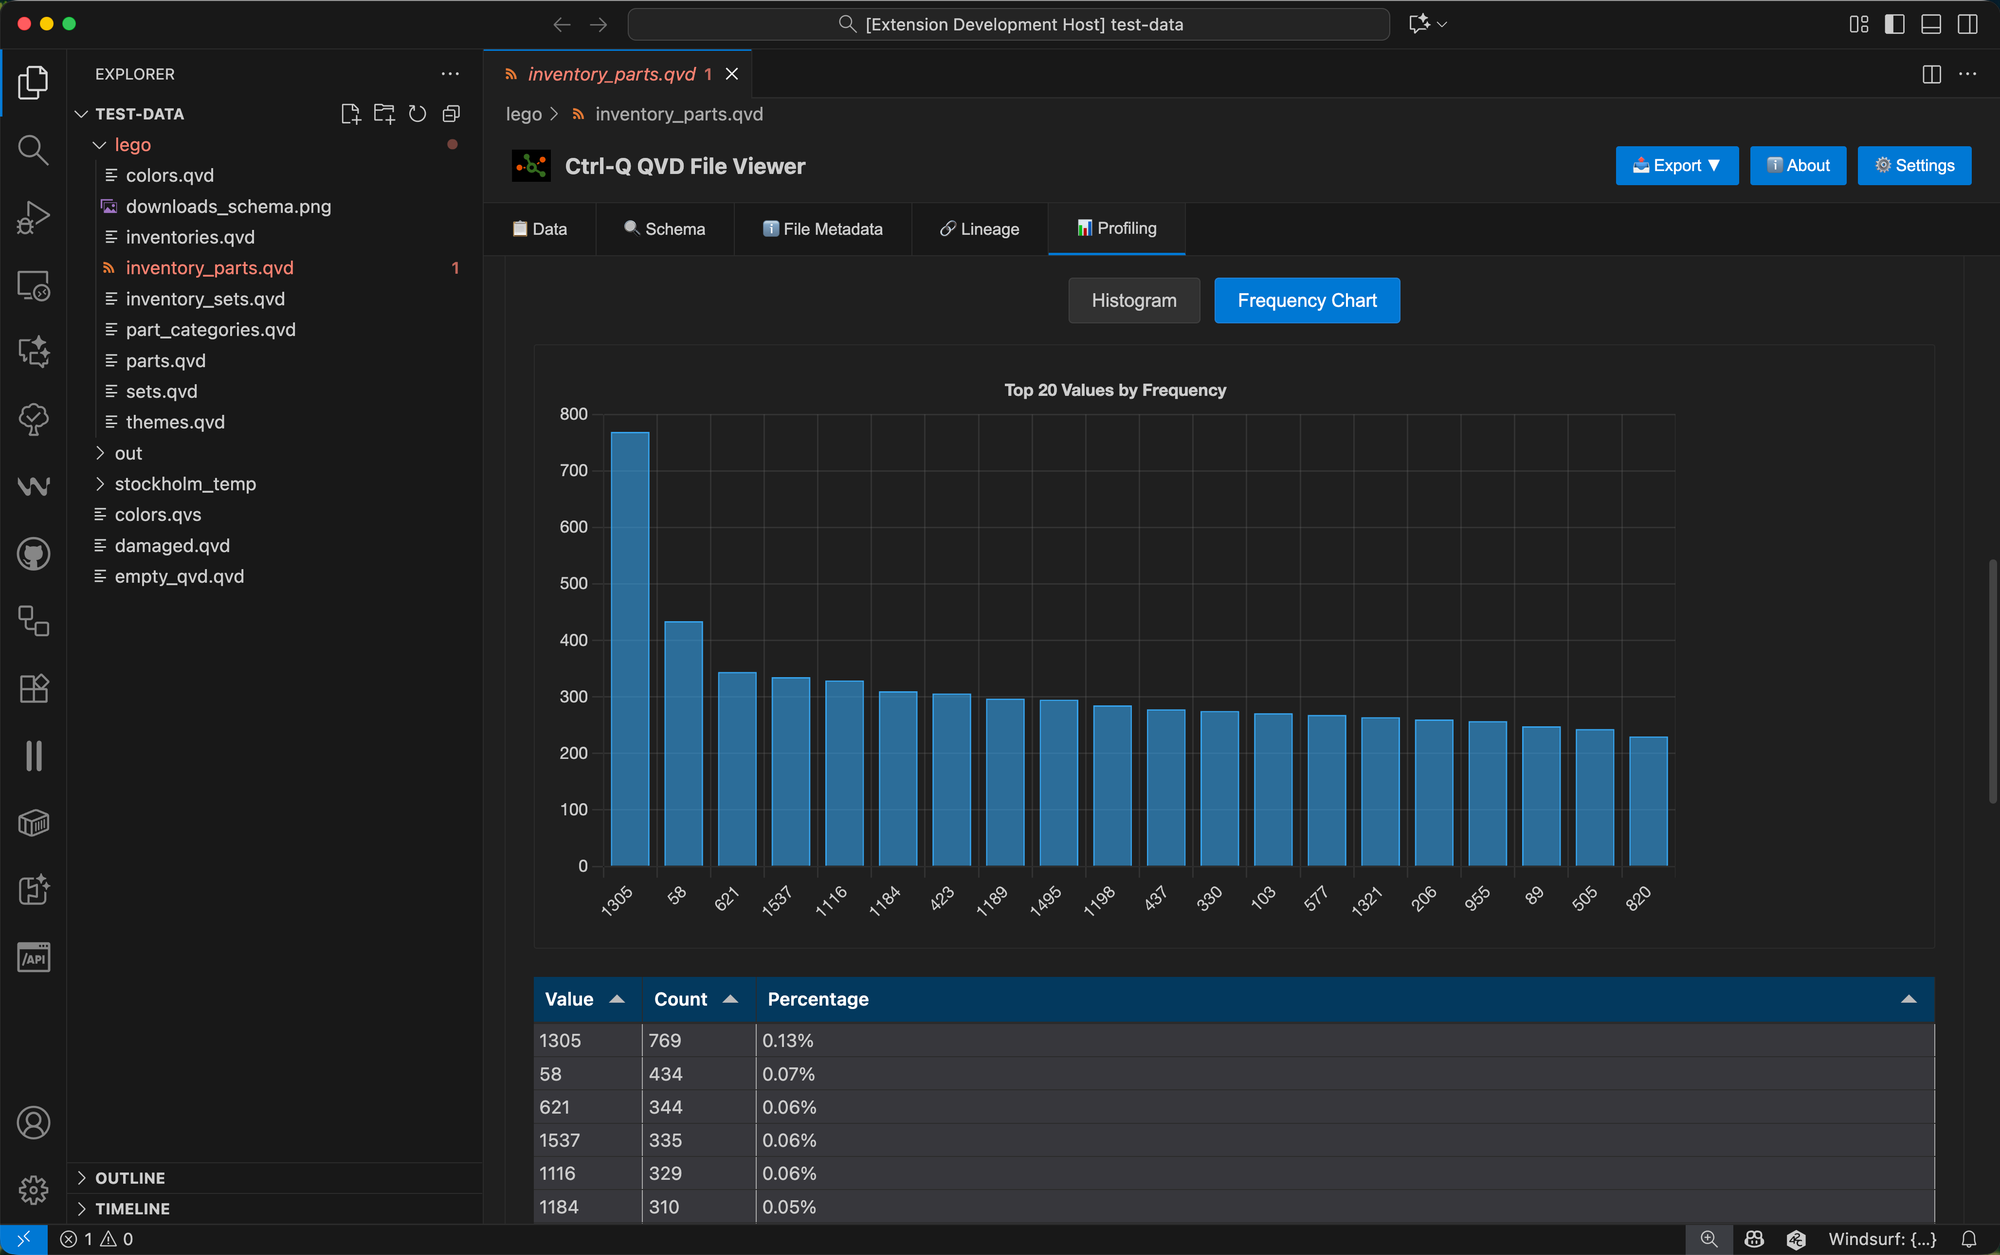
For categorical fields an interactive bar chart displays the top 20 most frequent values, giving you an immediate visual sense of the distribution.

The chart uses your VS Code theme colors. Below the chart, you'll find statistics such as: total rows, unique values, and NULL/empty counts.
Statistical Analysis for Numeric Fields
For fields with numeric values, the profiling goes deeper and does some statistical analysis too.
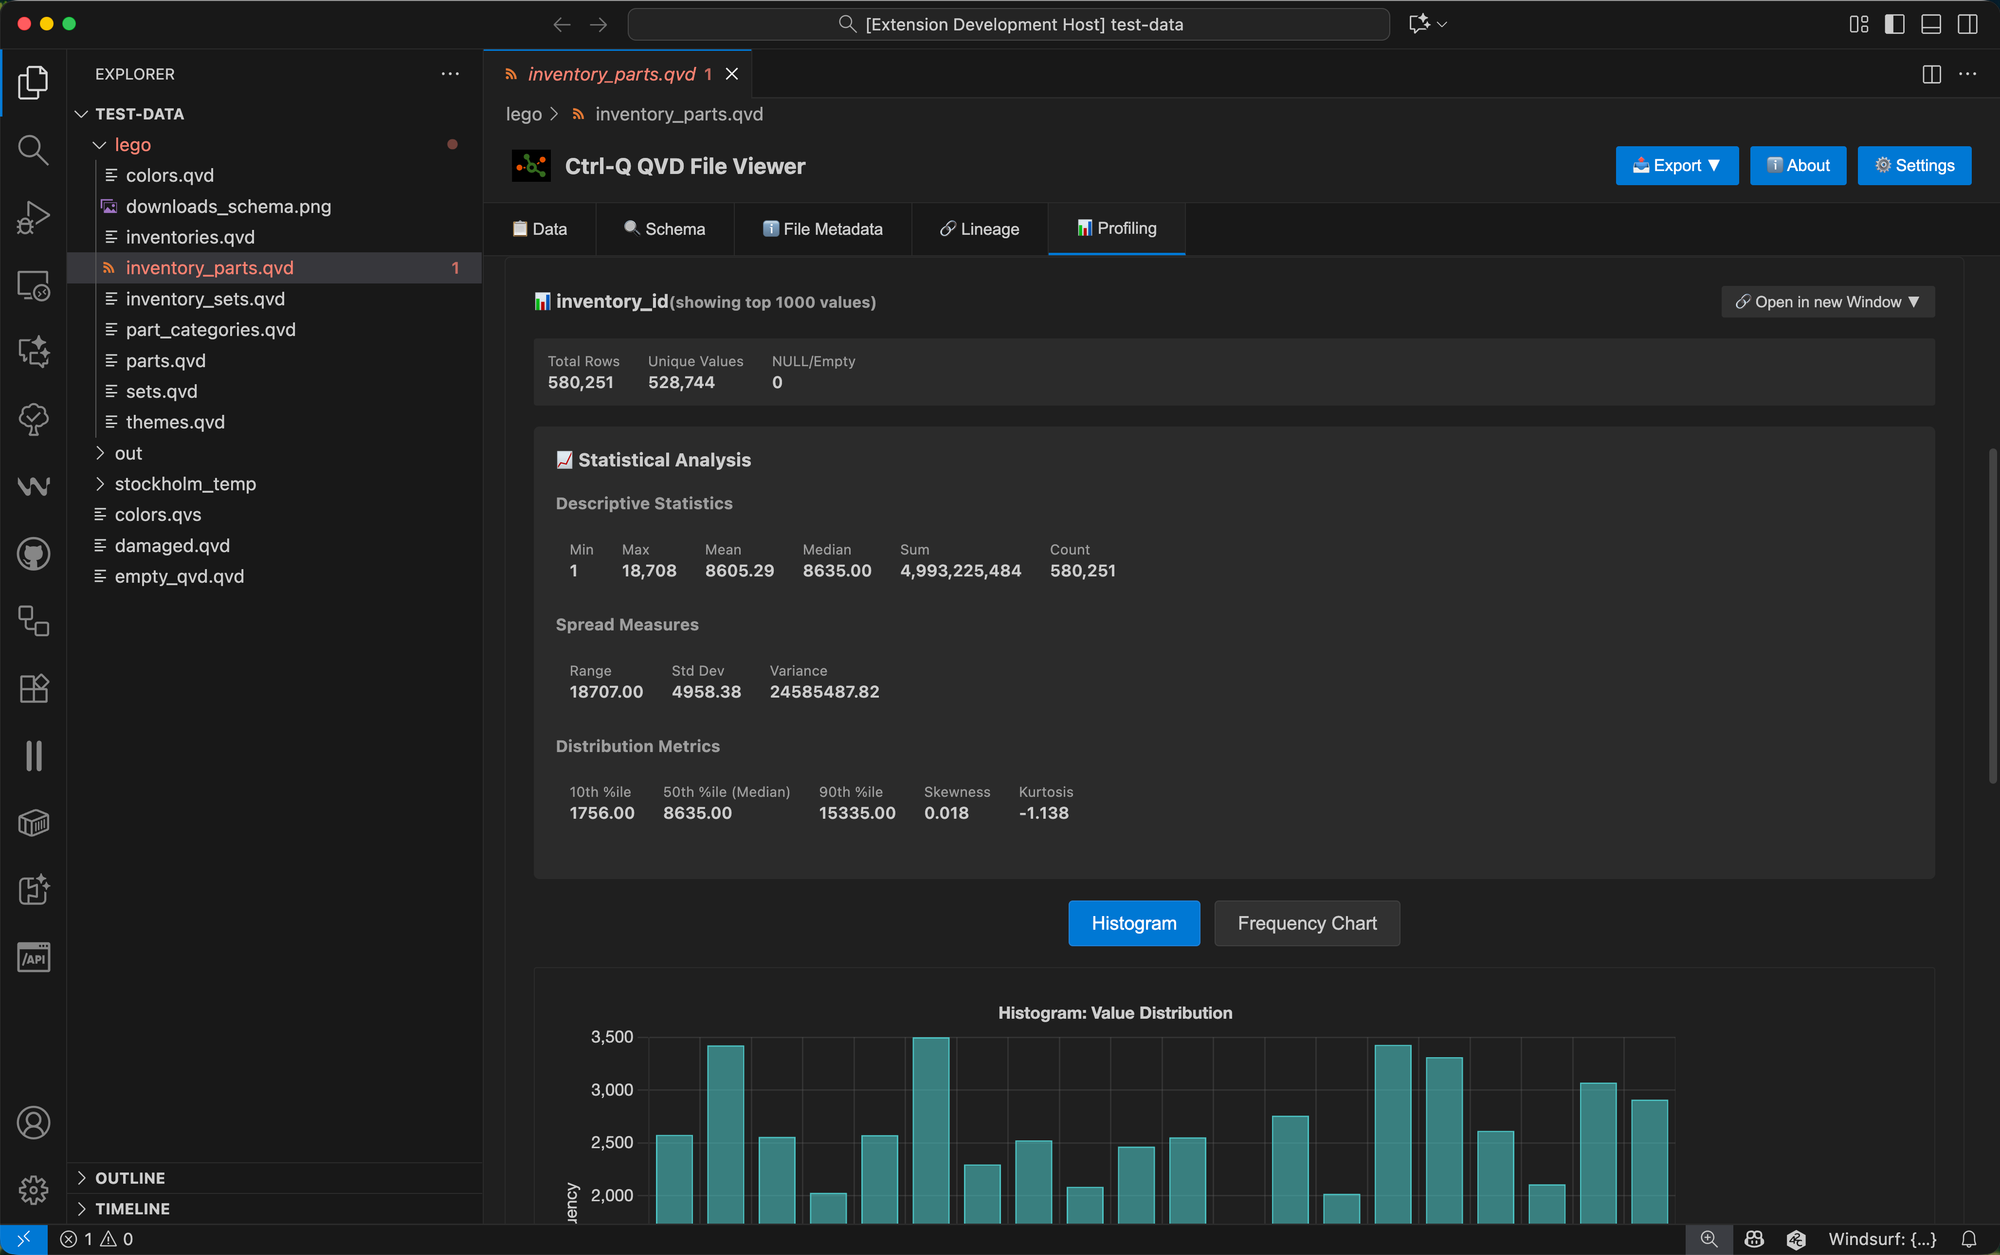
Instead of a frequency chart, numeric fields get a histogram showing the distribution across calculated bins, helping you understand whether your data is normally distributed, skewed, or has multiple peaks.
The statistical metrics include:
| Category | Metrics | Description |
|---|---|---|
| Descriptive Statistics | Min, max, mean, median | Basic statistical measures |
| Sum and count of non-null values | Aggregate values | |
| Spread Measures | Range | Difference between max and min |
| Standard deviation and variance | Variability metrics | |
| Distribution Metrics | Percentiles | 10th, 50th, 90th percentiles |
| Skewness | Distribution asymmetry | |
| Kurtosis | Tail heaviness |
This level of analysis is particularly useful for fields like sales amounts, temperatures, inventory levels, or any quantitative measure where understanding the distribution and identifying anomalies matters.
Detailed Distribution Tables
Beyond the visual charts, each field includes a complete distribution table showing every unique value, its count, and percentage of the total.
The table is sortable, searchable, and paginated for easy navigation.
For fields with more than 1,000 unique values, the distribution is automatically truncated for performance, but you can export the complete distribution using the export feature described below.
Exporting Profiling Results
One of the most practical features is the ability to export profiling results as Qlik .qvs scripts.
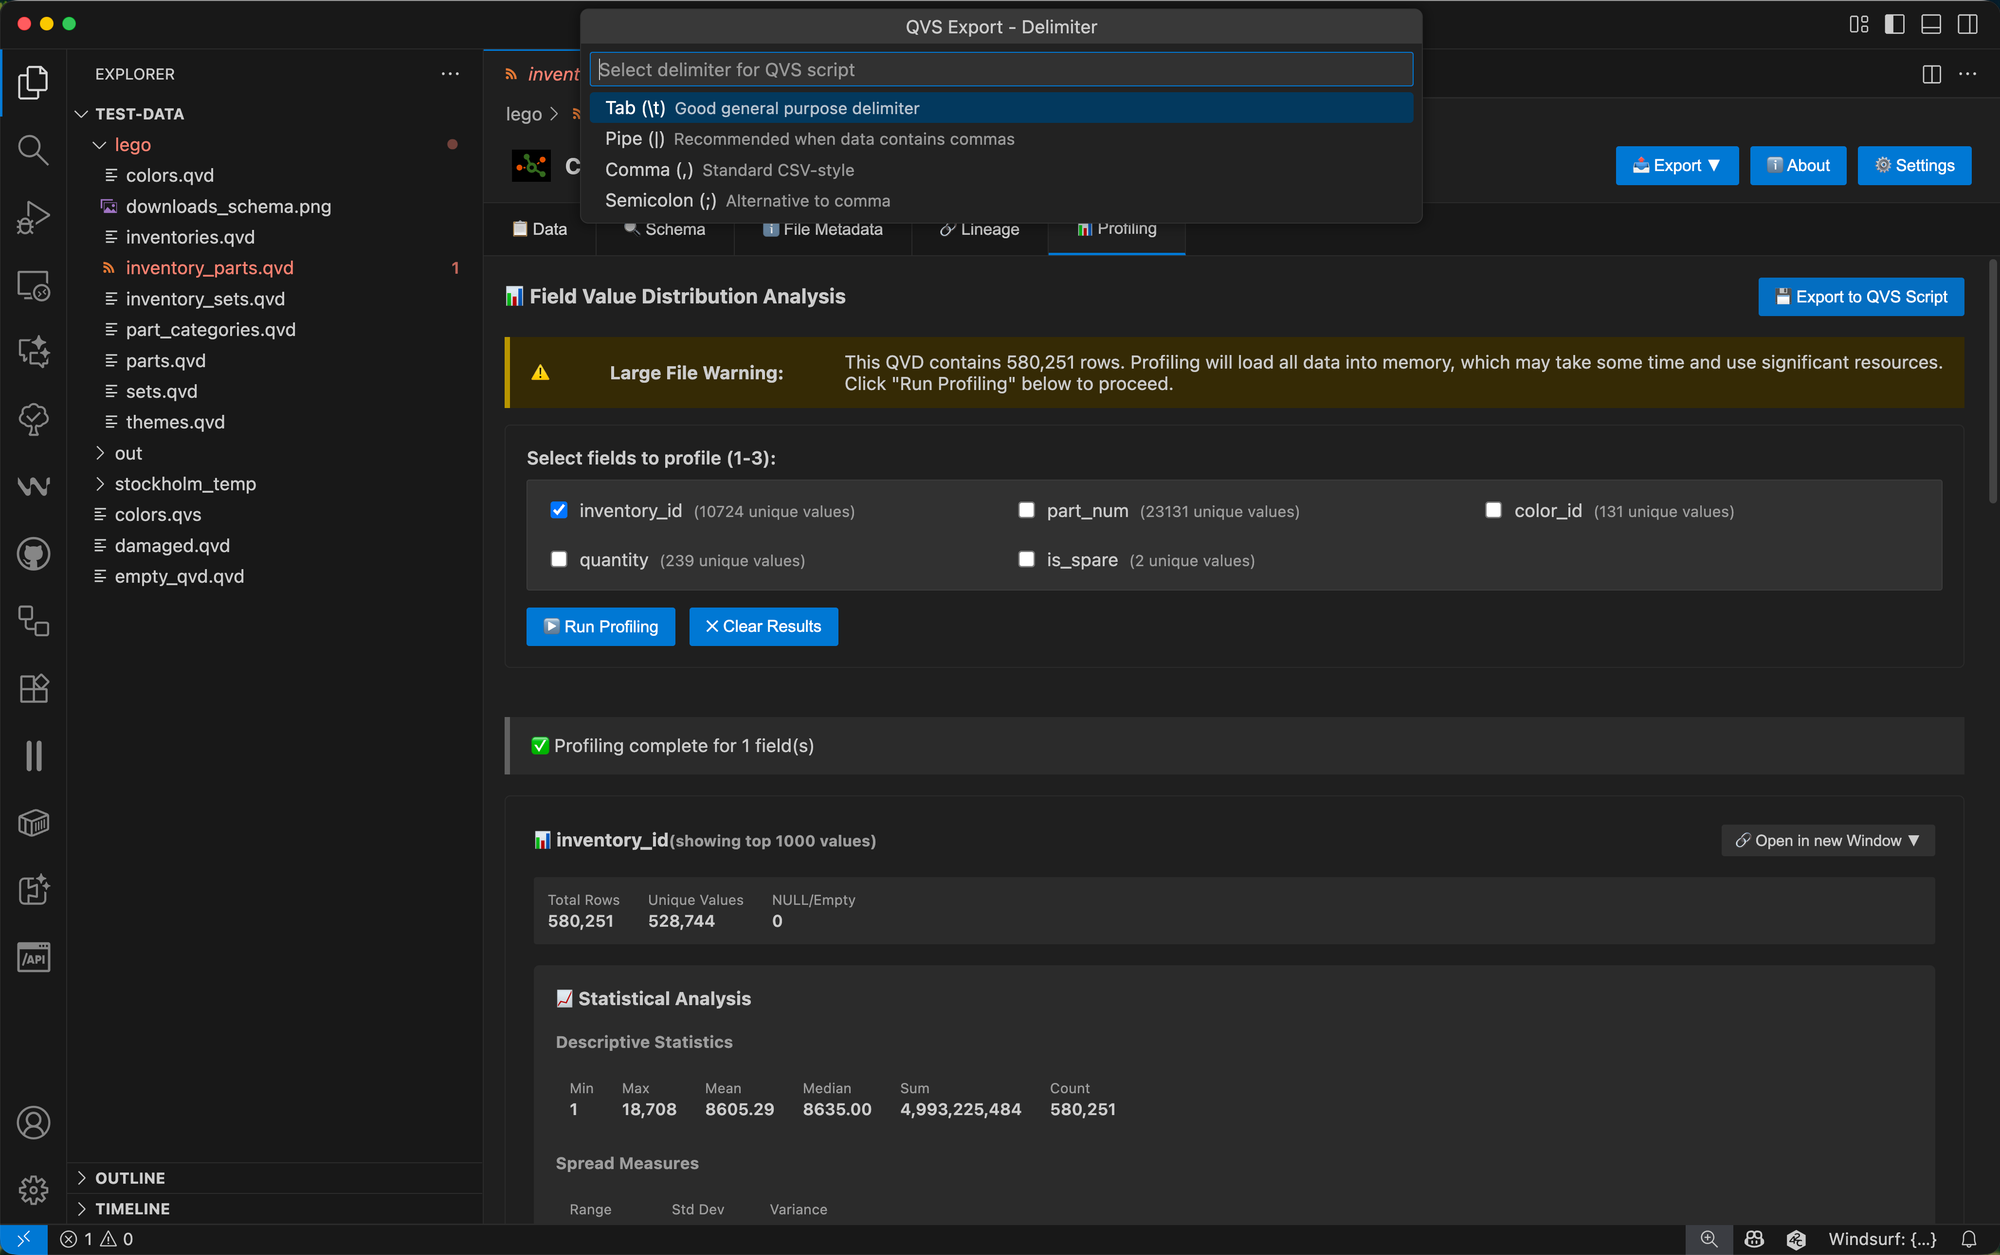
Click the 💾 Export to QVS Script button and choose your preferences:
Choose between tab, pipe, comma, or semicolon delimiters for the INLINE statements:
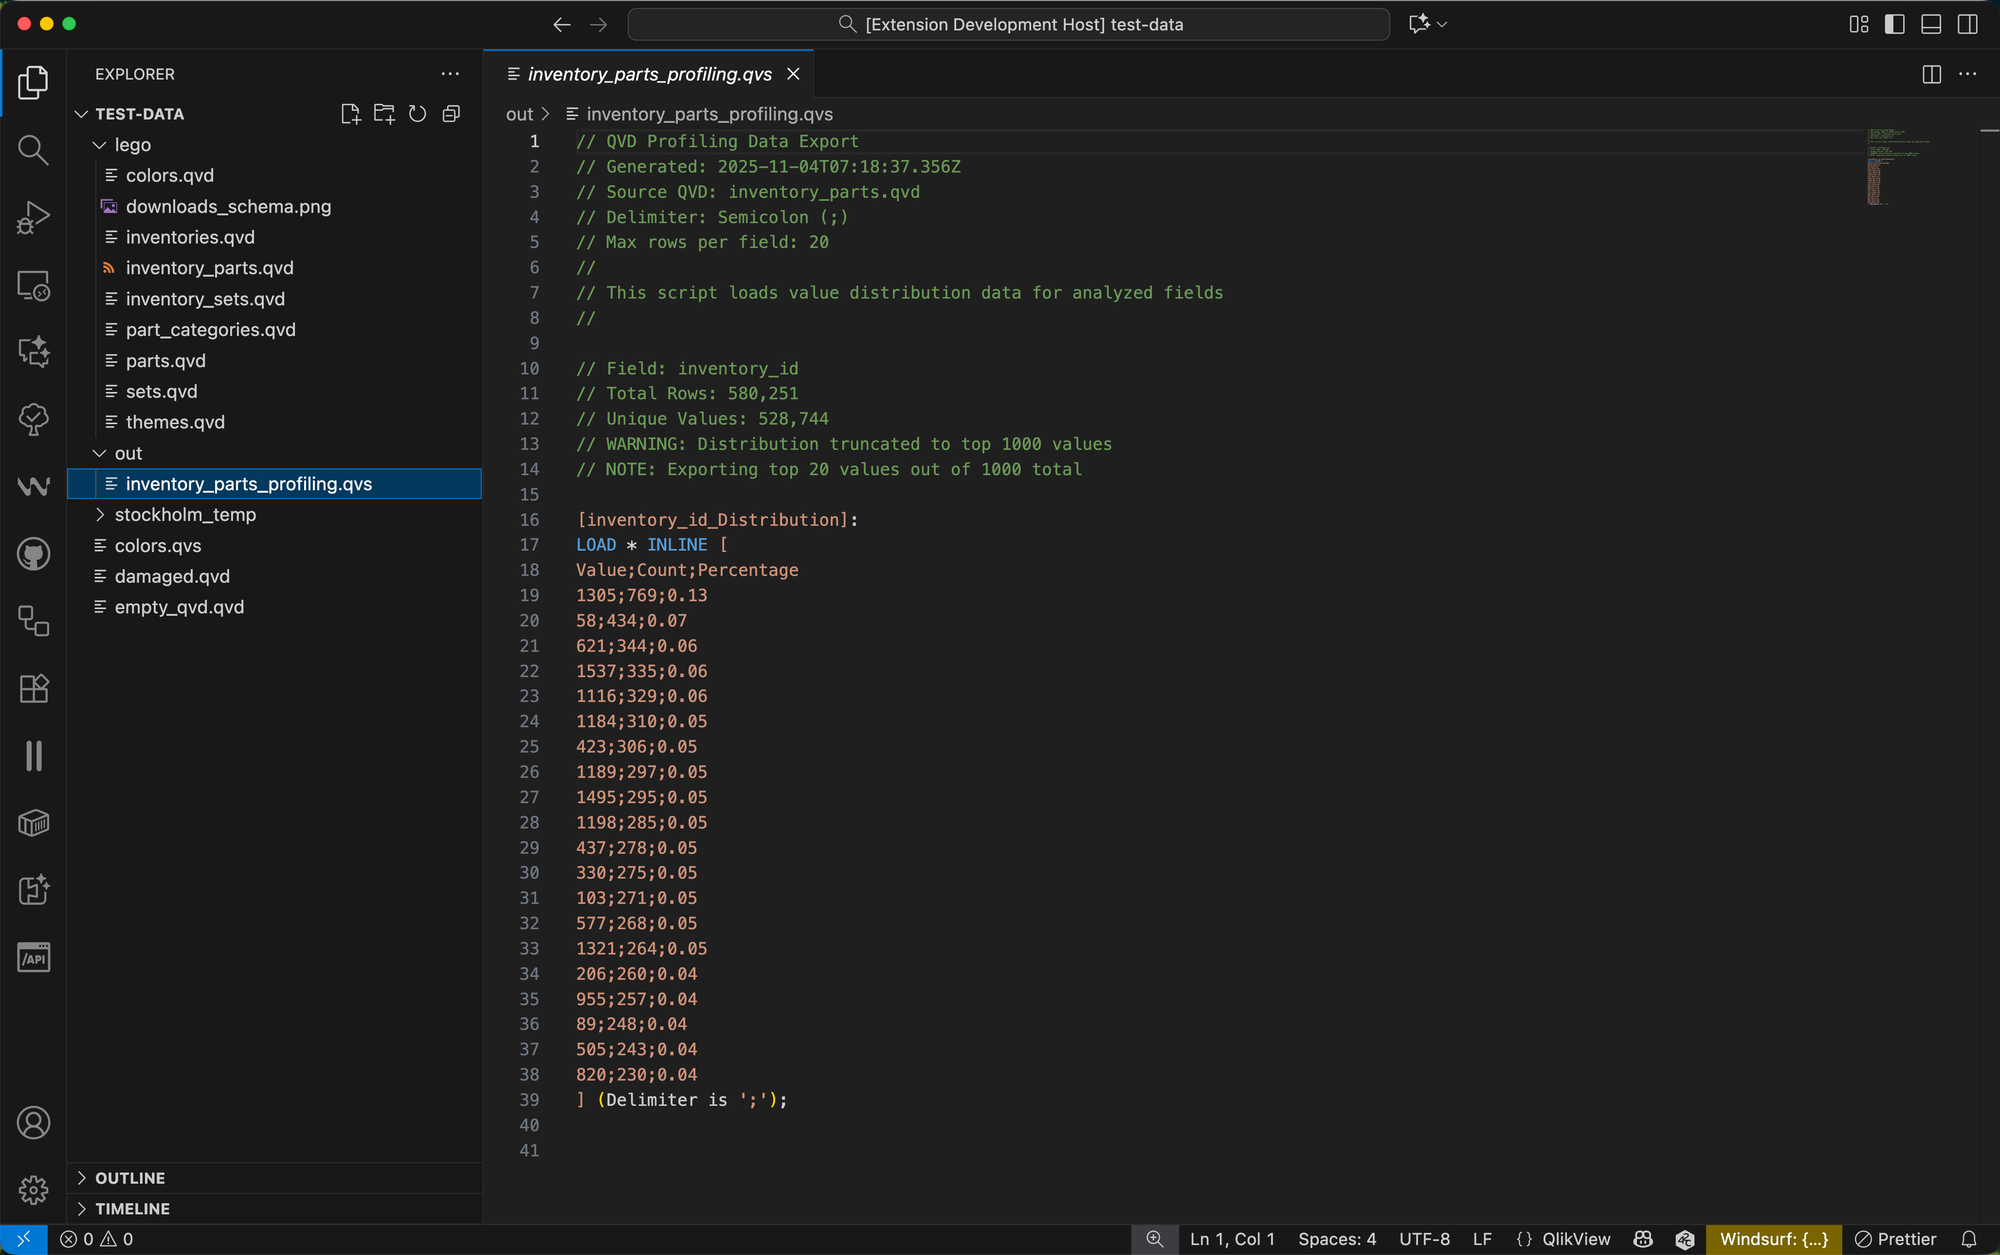
Finally, the generated script looks like this:
Real-World Use Cases
Dimension Analysis
Profile dimension fields from your star schema to understand their distributions.
For example, analyzing a customer_type field might reveal that 70% of your customers are "Retail" and 30% are "Wholesale" — information that influences how you structure your apps and build visualizations.
Data Quality Checks
Identify data issues before they make it into your applications.
Profiling might reveal that a country field has 15 different variations of "United States" due to inconsistent data entry, or that an expected field has an unexpectedly high NULL percentage.
For numeric fields, statistical analysis helps spot problems: a temperature field with a mean of 22.5°C but 15 outliers above 45°C clearly deserves investigation.
Performance Optimization
Understanding field cardinality helps with performance optimization.
High-cardinality fields (many unique values) behave differently than low-cardinality fields (few unique values) in Qlik's associative engine.
Profiling tells you immediately whether an order_id field has 1 million unique values (100% cardinality) or if order_status has only 5 unique values — information that influences indexing and memory usage.
Quantitative Analysis
Use the statistical metrics for numeric fields to understand business patterns.
Profile an order_amount field and discover the mean is $125 but the median is only $89, indicating a right-skewed distribution with some high-value orders pulling up the average.
Documentation and Team Collaboration
Export profiling results to create data dictionaries, document field characteristics, or share insights with team members.
The markdown export option is particularly useful for documentation, while the QVS export brings profiling data directly into Qlik Sense for quick prototyping.
Getting Started
If you haven't installed Ctrl-Q QVD Viewer yet, it's available in the VS Code marketplace:
- Open VS Code
- Go to Extensions (`Ctrl+Shift+X` or `Cmd+Shift+X`)
- Search for "Ctrl-Q QVD Viewer" or just "QVD"
- Click Install
For existing users, the extension will update automatically to version 1.2.0 (assuming auto-updates are enabled).
Once installed, simply open any QVD file, navigate to the 📊 Profiling tab, select your fields, and start exploring your data distributions.