qs-log-scanner: Open source tool for exploring Qlik Sense logs
Let's do a deep-dive into the logs of client-managed Qlik Sense (QSEoW), looking at what kind of logs it creates. The qs-log-scanner tool captures, groups, and visualizes log subsystems and log levels so you can understand which real-time signals exist for monitoring your Qlik Sense environment.

If you’re a Qlik Sense admin or developer and you’ve ever wondered “what kind of data does Qlik Sense actually store in all those log files?”, this post is for you.
We’ll talk about QMC configuration, networking, Log4Net UDP appenders, log levels, and how to interpret the messages.
Fun stuff, right?
Why I built this
For years I’ve been curious about the full set of log messages available from client-managed Qlik Sense (Qlik Sense Enterprise on Windows, QSEoW).
The question really came up while working on the open-source, free to use Butler and Butler SOS tools.
Butler provides reload task failure alerts, Sense license monitoring, monitoring of Windows services, a key-value store that can be used from Sense load scripts - and much more...
Butler SOS focus on gathering real-time, operational metrics - and making them available as great looking dashboards in Grafana or New Relic.
A lot of the power of those tools come from ingesting real-time data from Qlik Sense — mostly UDP messages with log information. These messages correspond 1-1 to the log entries written to Sense's log files.
But monitoring is only as good as the signals you can observe.
So…
- What log messages are there?
- What subsystems generate them?
- What log levels do they show up on?
- And which Qlik Sense services can actually forward logs as UDP?
A few hours of vibe coding later, and voila:
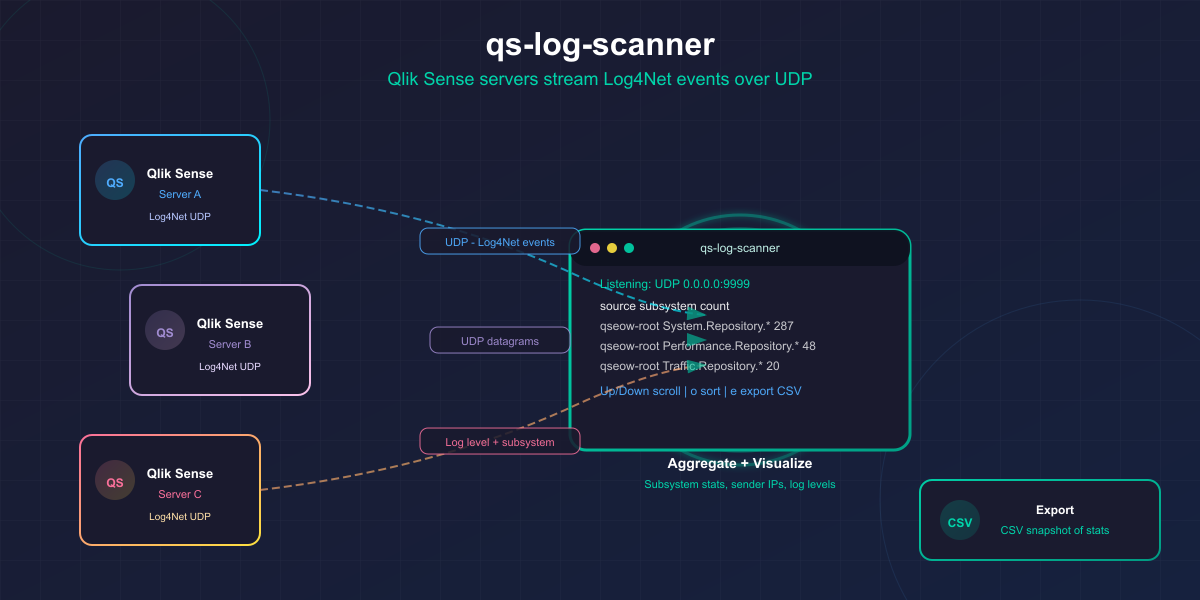
qs-log-scanner: a small terminal UI tool that listens for Log4Net UDP messages from Qlik Sense, aggregates them by source/subsystem, and shows you what it finds.
What qs-log-scanner does
qs-log-scanner is a small terminal UI tool that receives Log4Net UDP messages from Qlik Sense, parses them, and aggregates what it sees.
In practice it helps you answer questions like:
- What log subsystems exist in my environment?
- Which subsystems are the noisiest?
- Which subsystems emit warnings/errors?
- How does the configured QMC log level affect what gets emitted?
Here’s the UI:
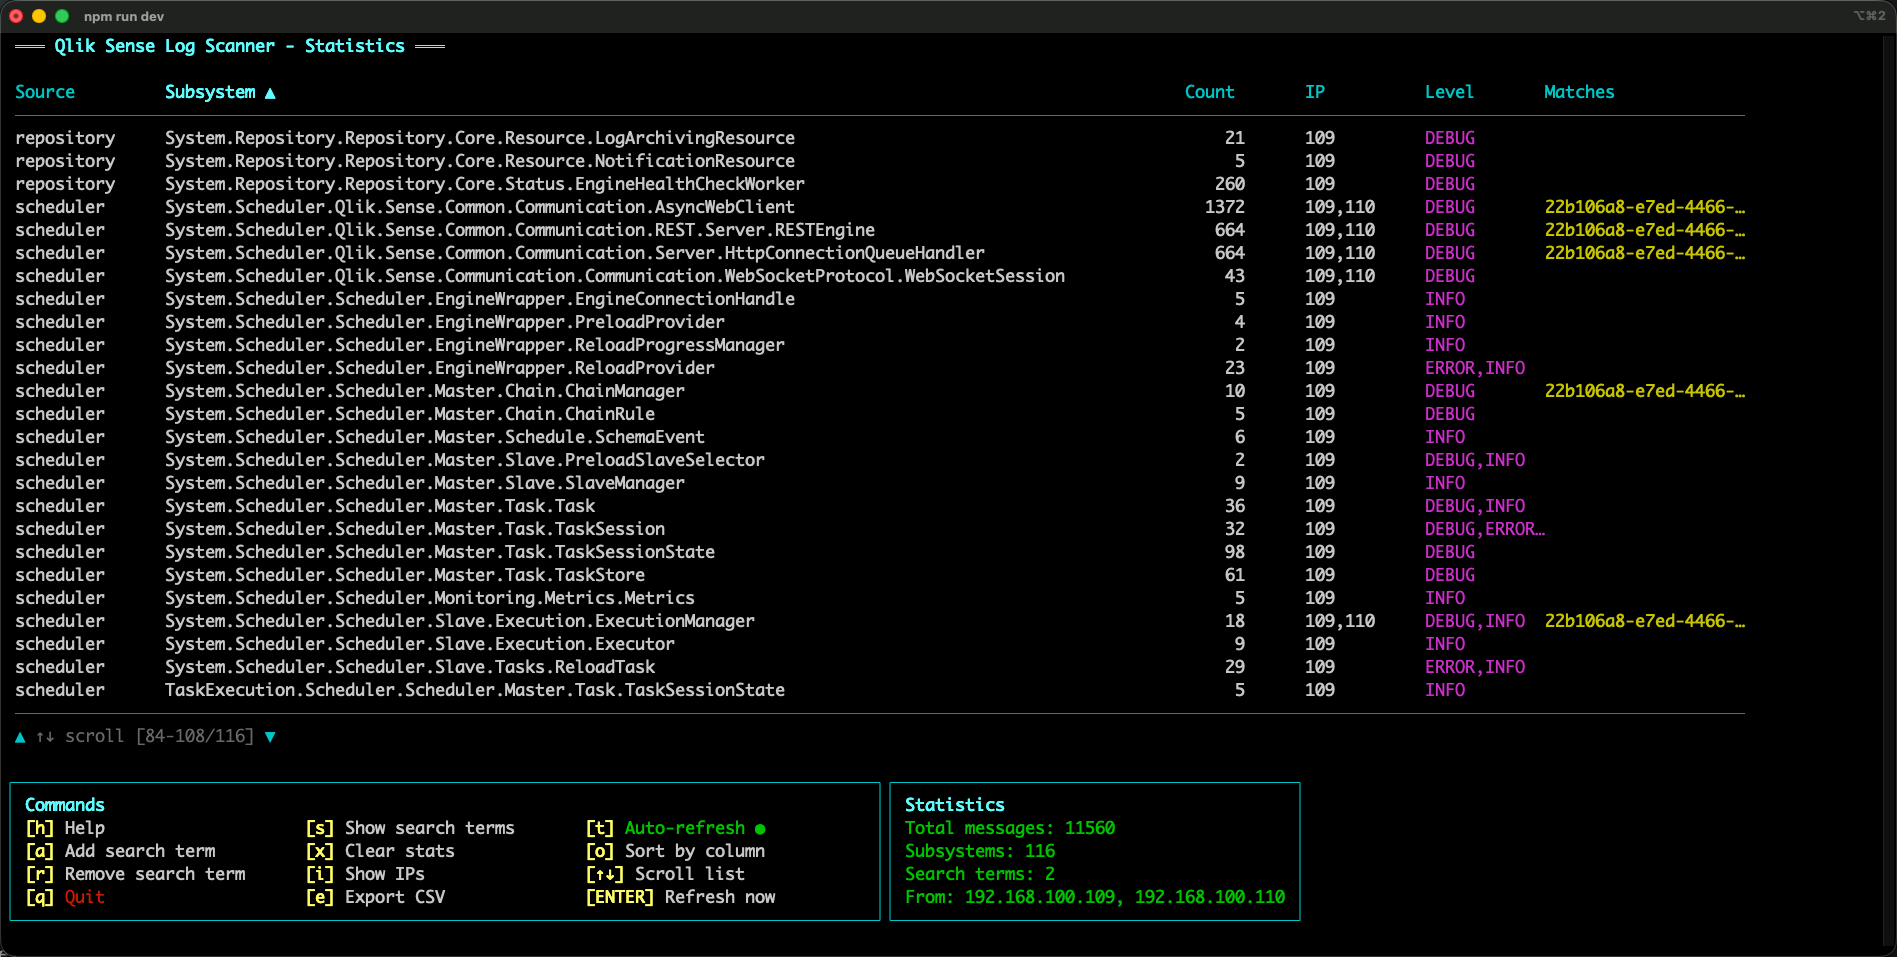
You can sort by source/subsystem/count/IP:
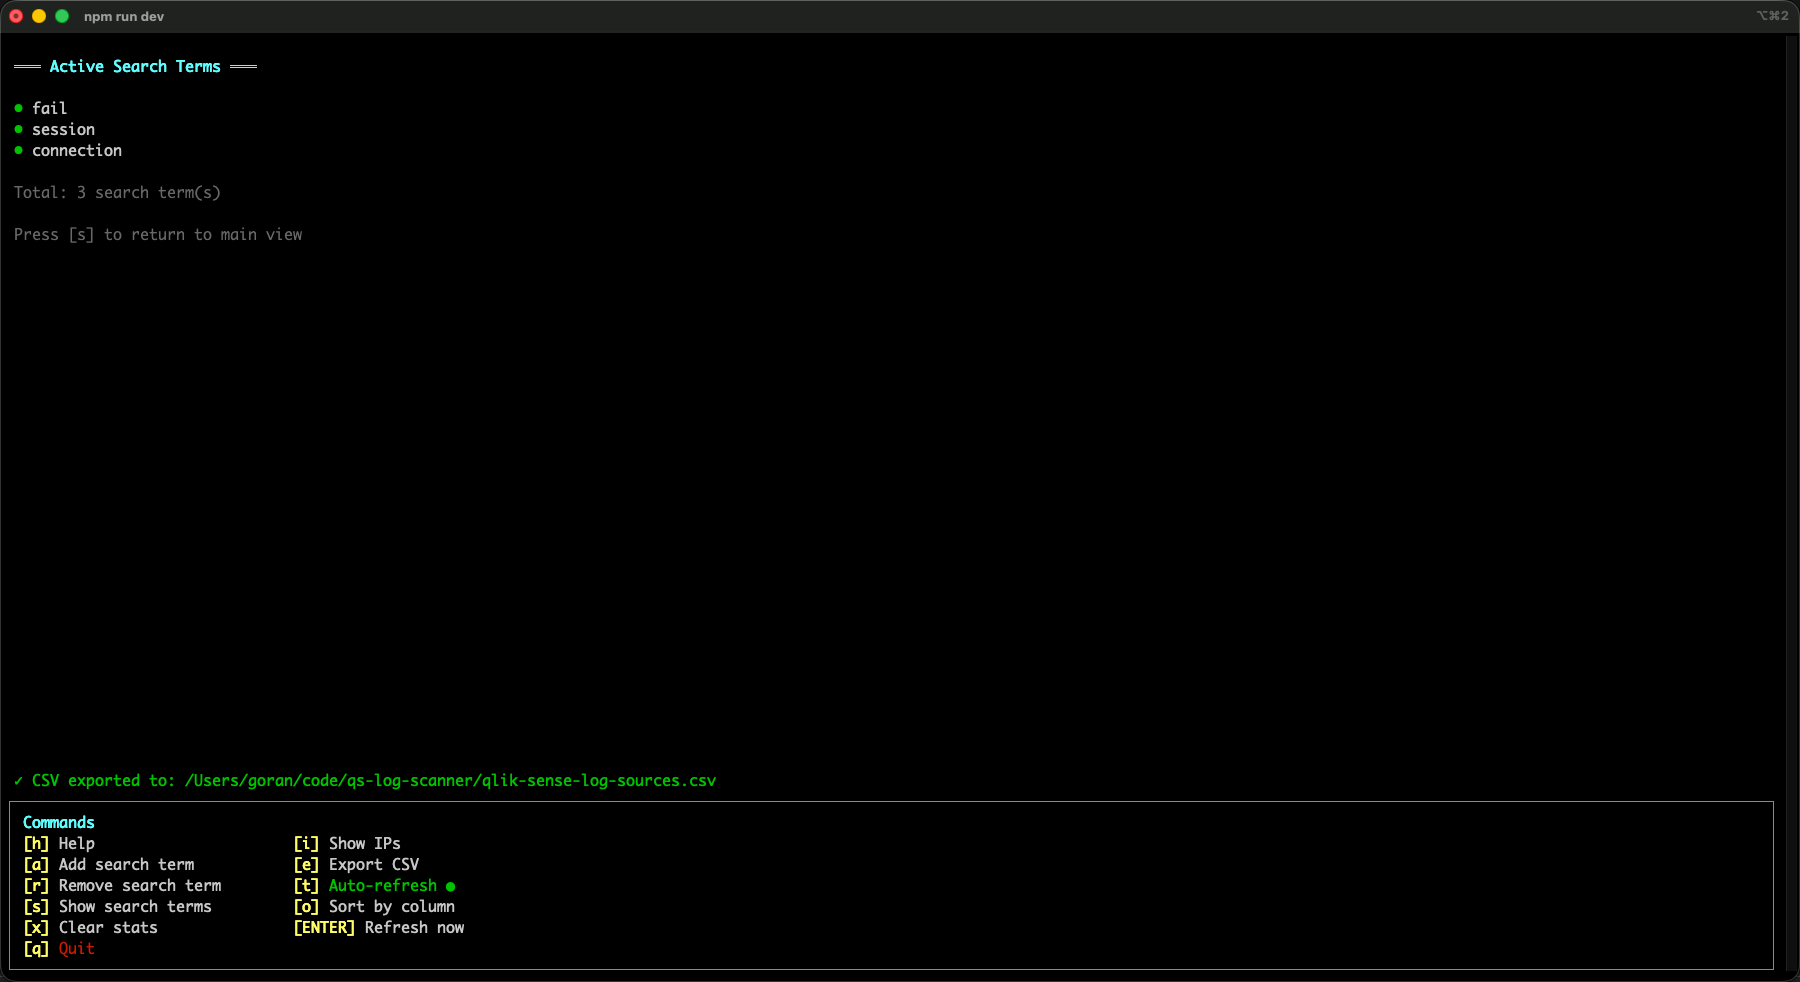
Exporting
qs-log-scanner can export the currently aggregated statistics to a CSV file.
This is useful when you want to:
- Get as complete a picture as possible of what subsystems exist and what log levels they emit
- Share results with others (for example, “top subsystems” or “which subsystems ever emit WARN/ERROR”)
The export includes one row per (source, subsystem) and (among other fields) the count, log levels seen and sender IPs.
Search terms: following one thing across many subsystems
The stats table is great for answering “what’s noisy?” and “what exists?”, but sometimes you want to follow _one specific thing_ across the log stream.
That’s what search terms are for.
You add one or more search terms (any string), and qs-log-scanner will track which subsystems produced messages that matched those terms.
In the UI this shows up in the Matches column for each (source, subsystem) row.
Why is that useful?
Because a single real-world event in Sense (for example a reload) often fans out into multiple log messages across multiple subsystems.
The screenshot below shows a concrete example:
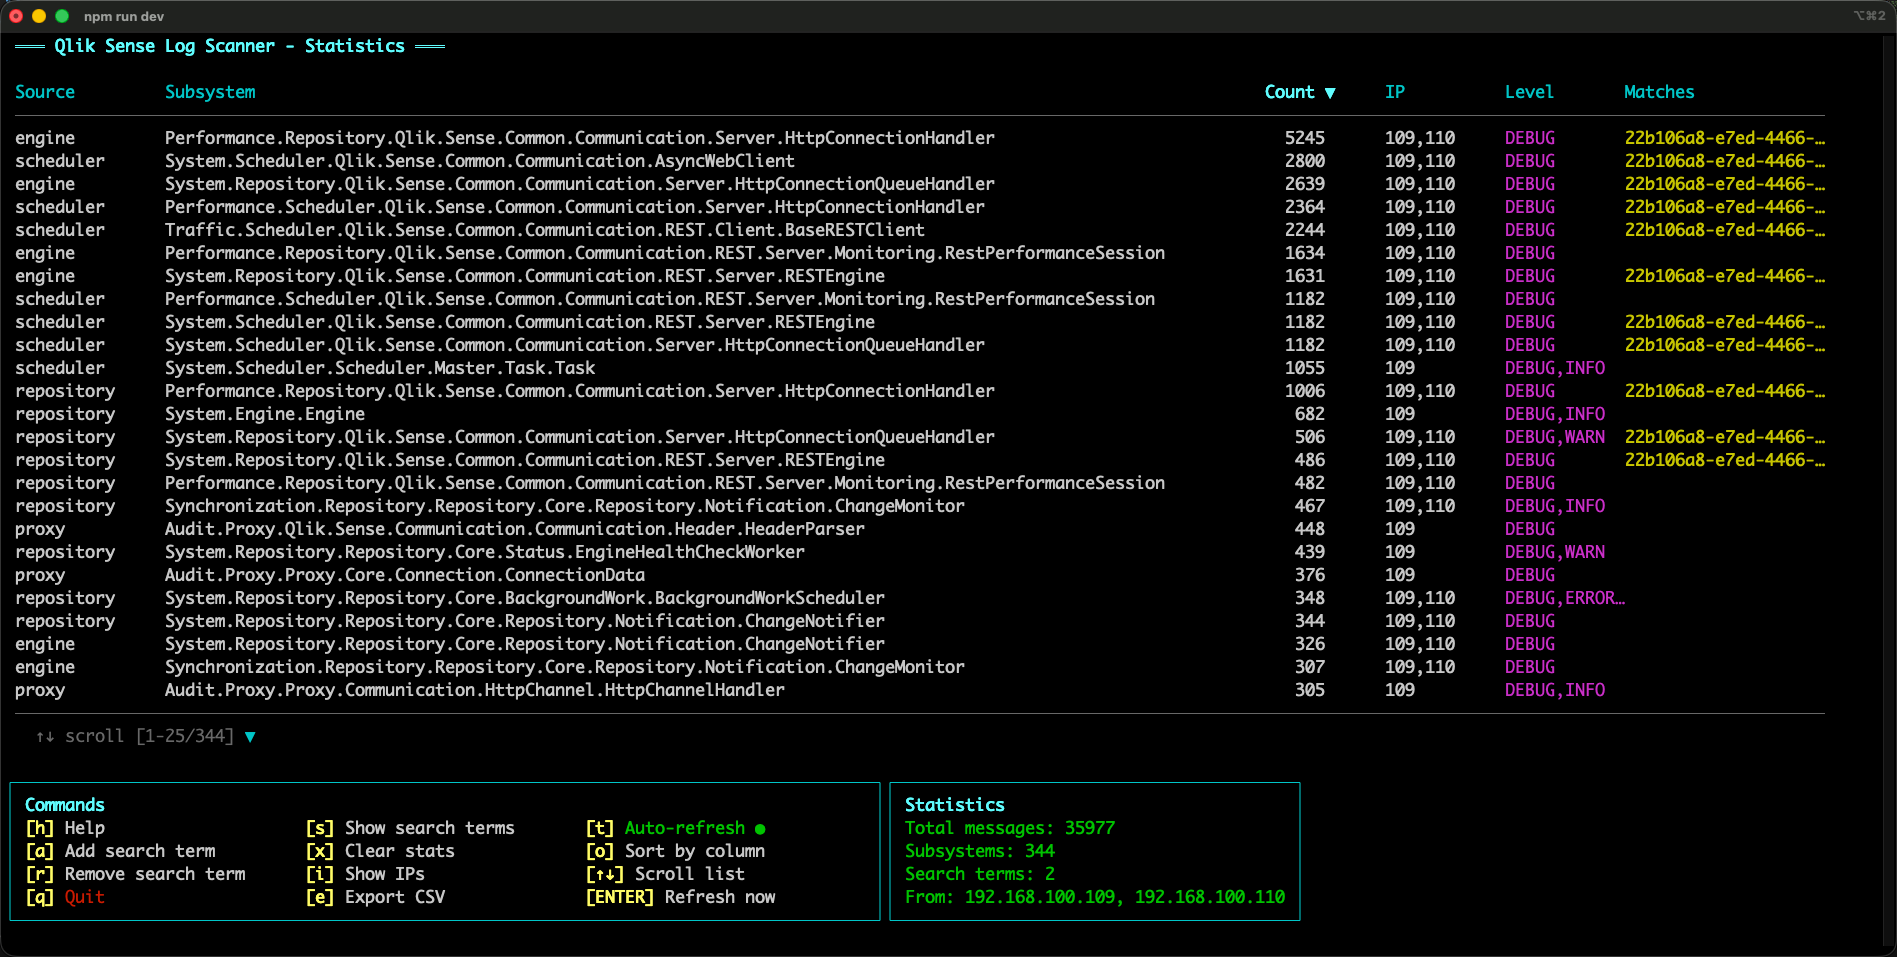
In that capture, a reload task ID shows up in several subsystems.
Most of those messages are DEBUG, but there’s also a WARN — that specific reload failed, so a warning was logged.
By adding the reload task ID as a search term, you can quickly identify which subsystems participated in the story of that reload, and at which log levels.
That’s extremely helpful when you’re trying to decide what’s worth monitoring (and what log level you’d need enabled to see it).
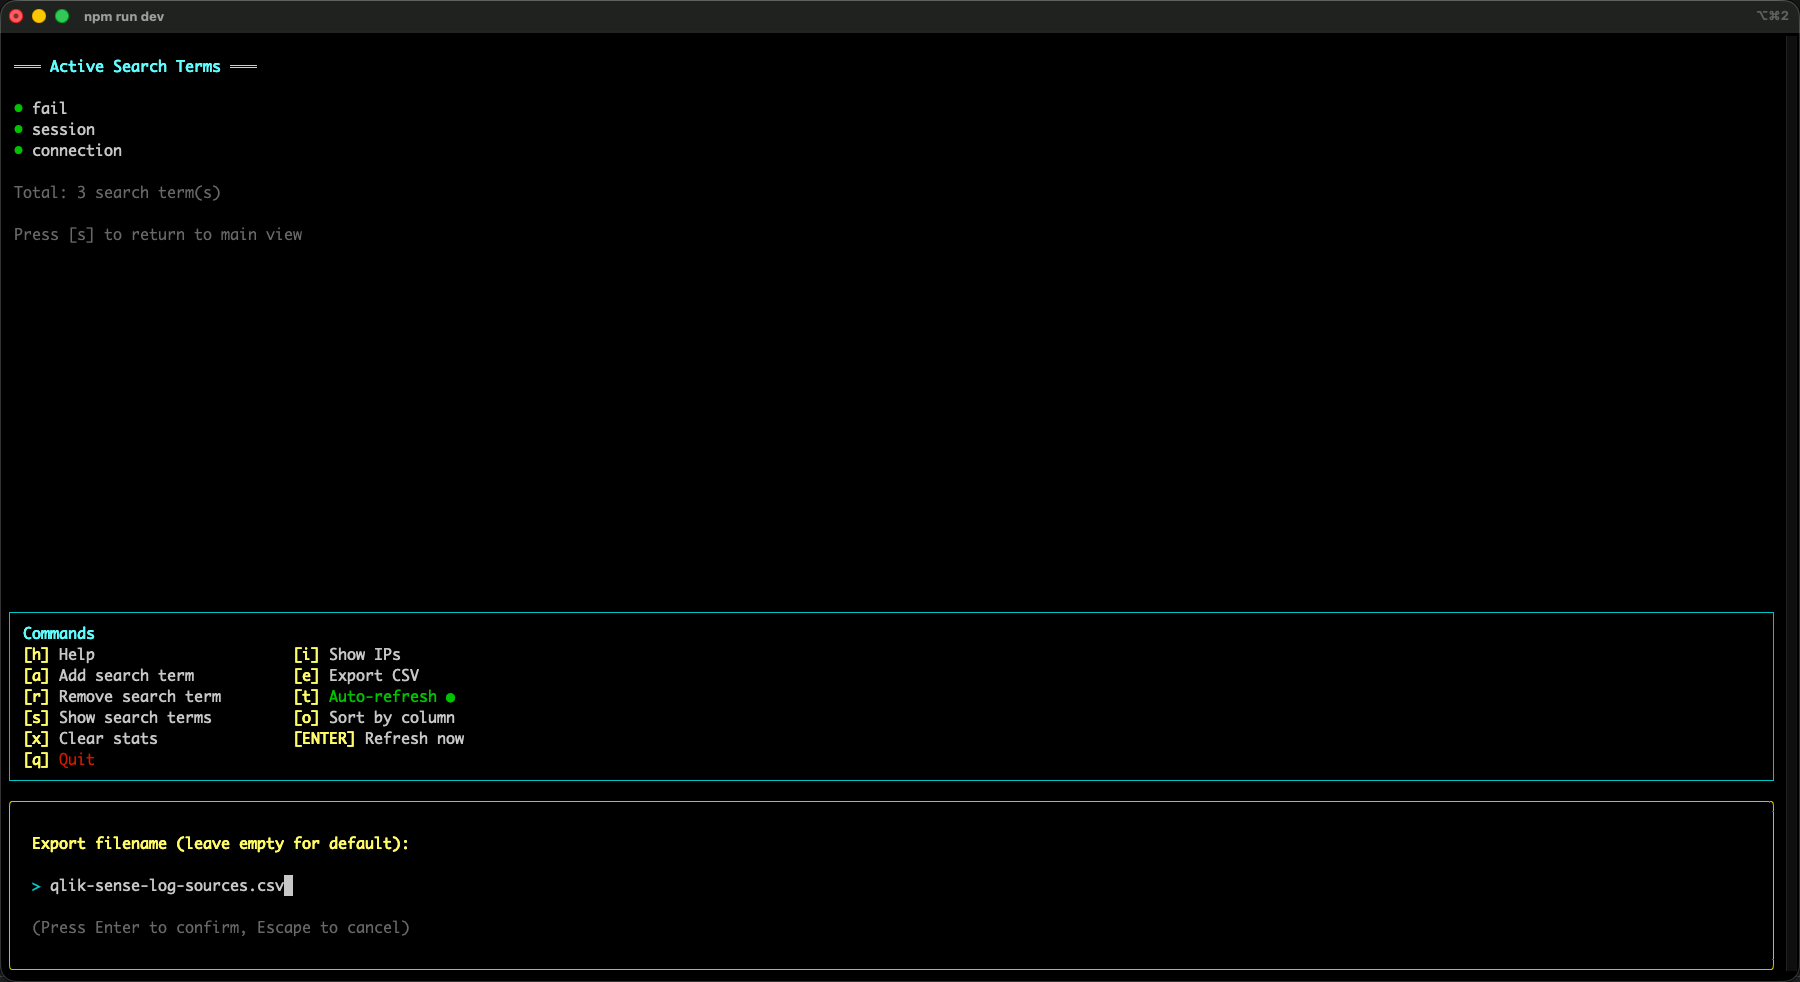
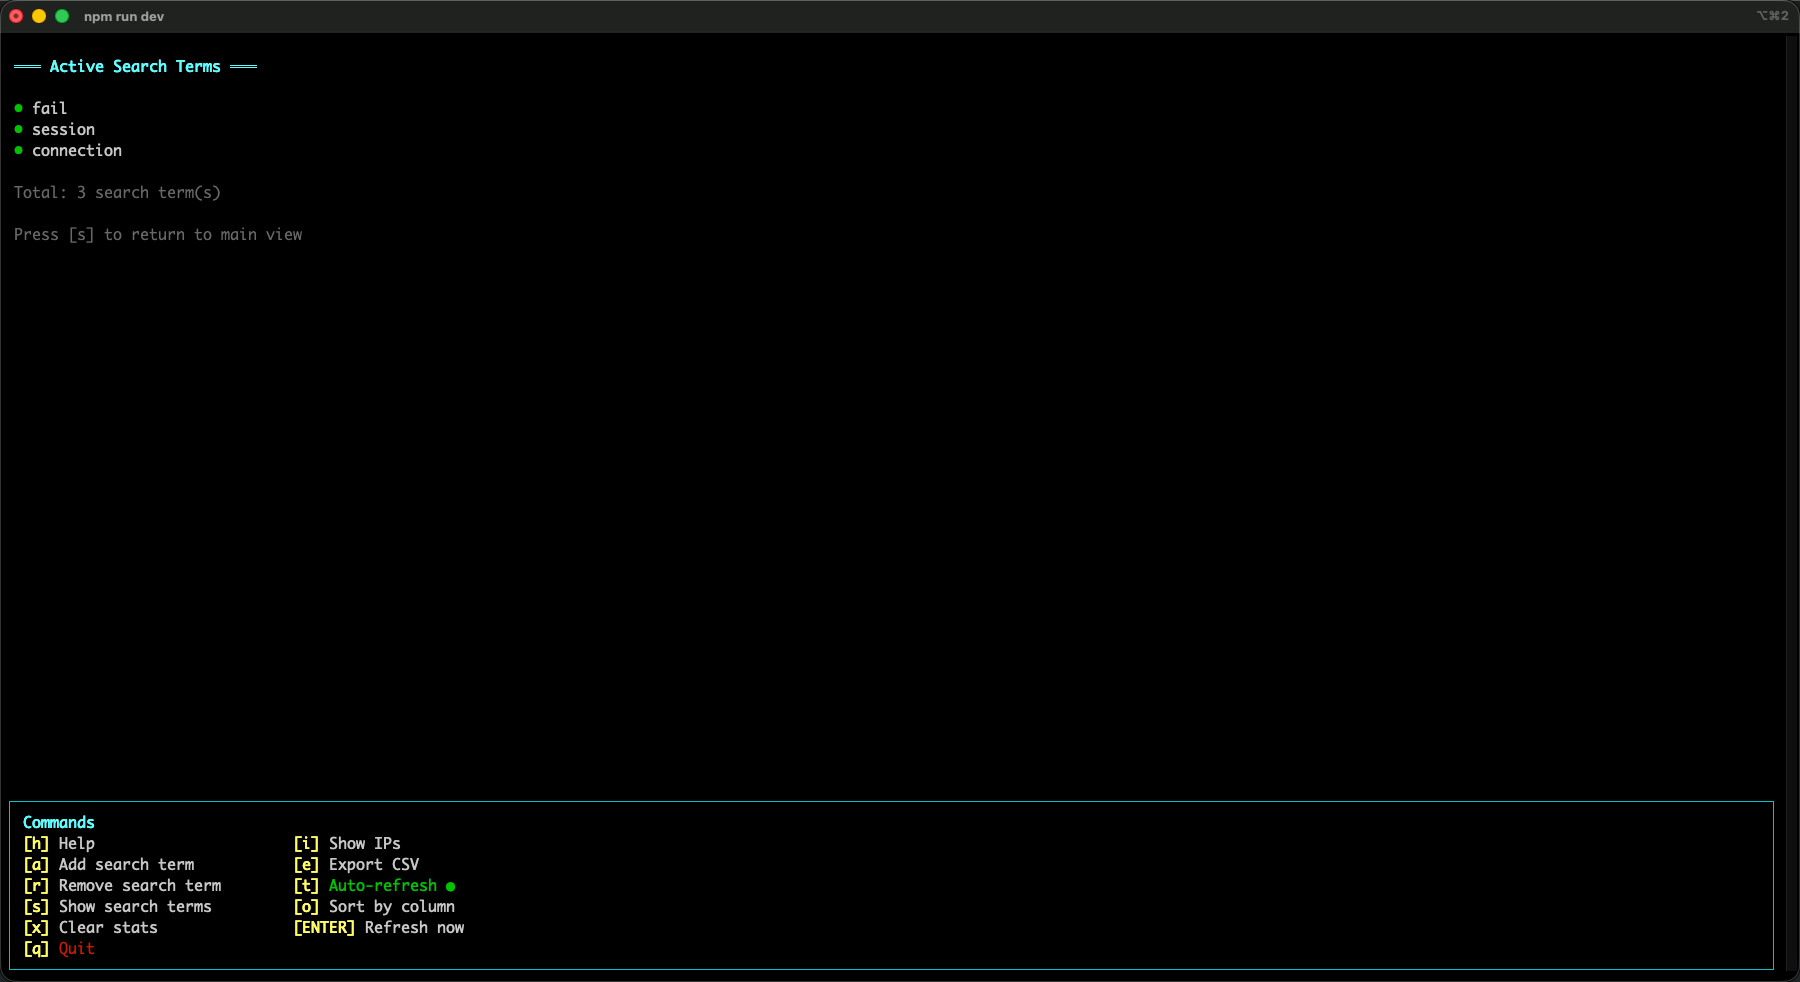
Here’s what it looks like when search terms are active (here there are three terms being tracked):
Important 1: not all Qlik logs can be forwarded as UDP
Qlik Sense has many log files.
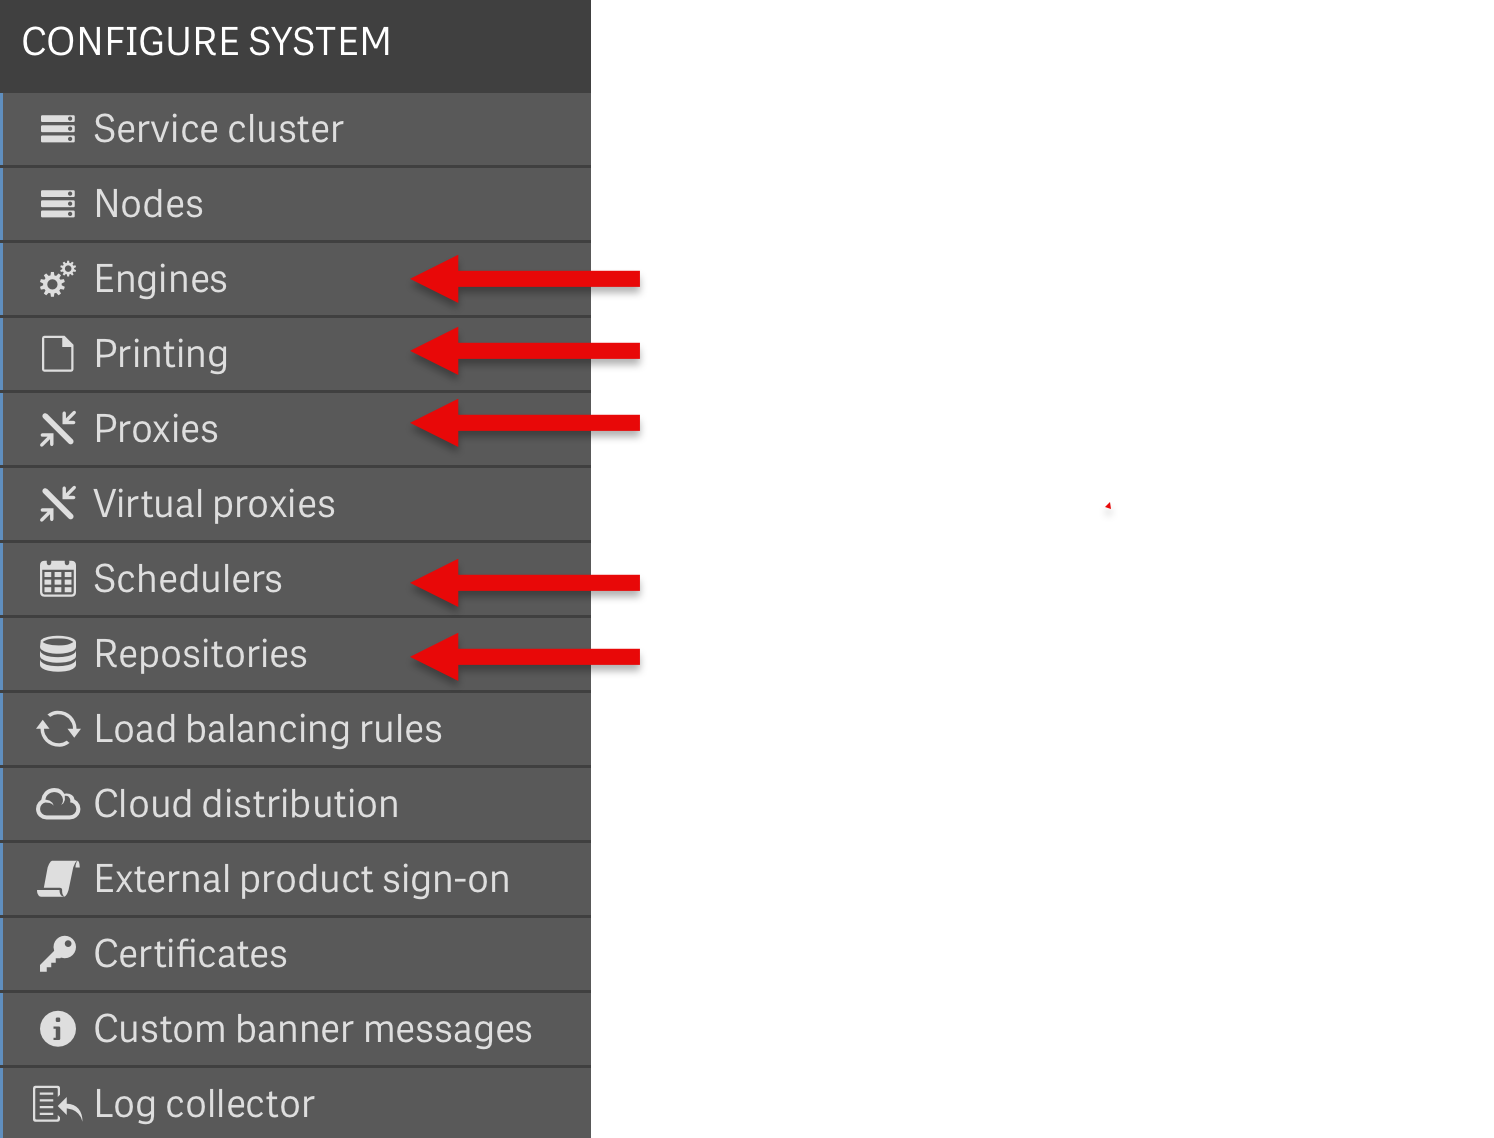
But only the logs described under the Tracing header in the QMC sections for these services can be forwarded as UDP messages:
- Engines
- Printing
- Proxies
- Schedulers
- Repositories
Other log settings in the QMC won’t result in Log4Net UDP events being emitted.
In QMC it looks like below.
The sections marked with red arrows can be configured to emit UDP messages (by placing the UDP appender XML file in their service folders, see further down for more info):
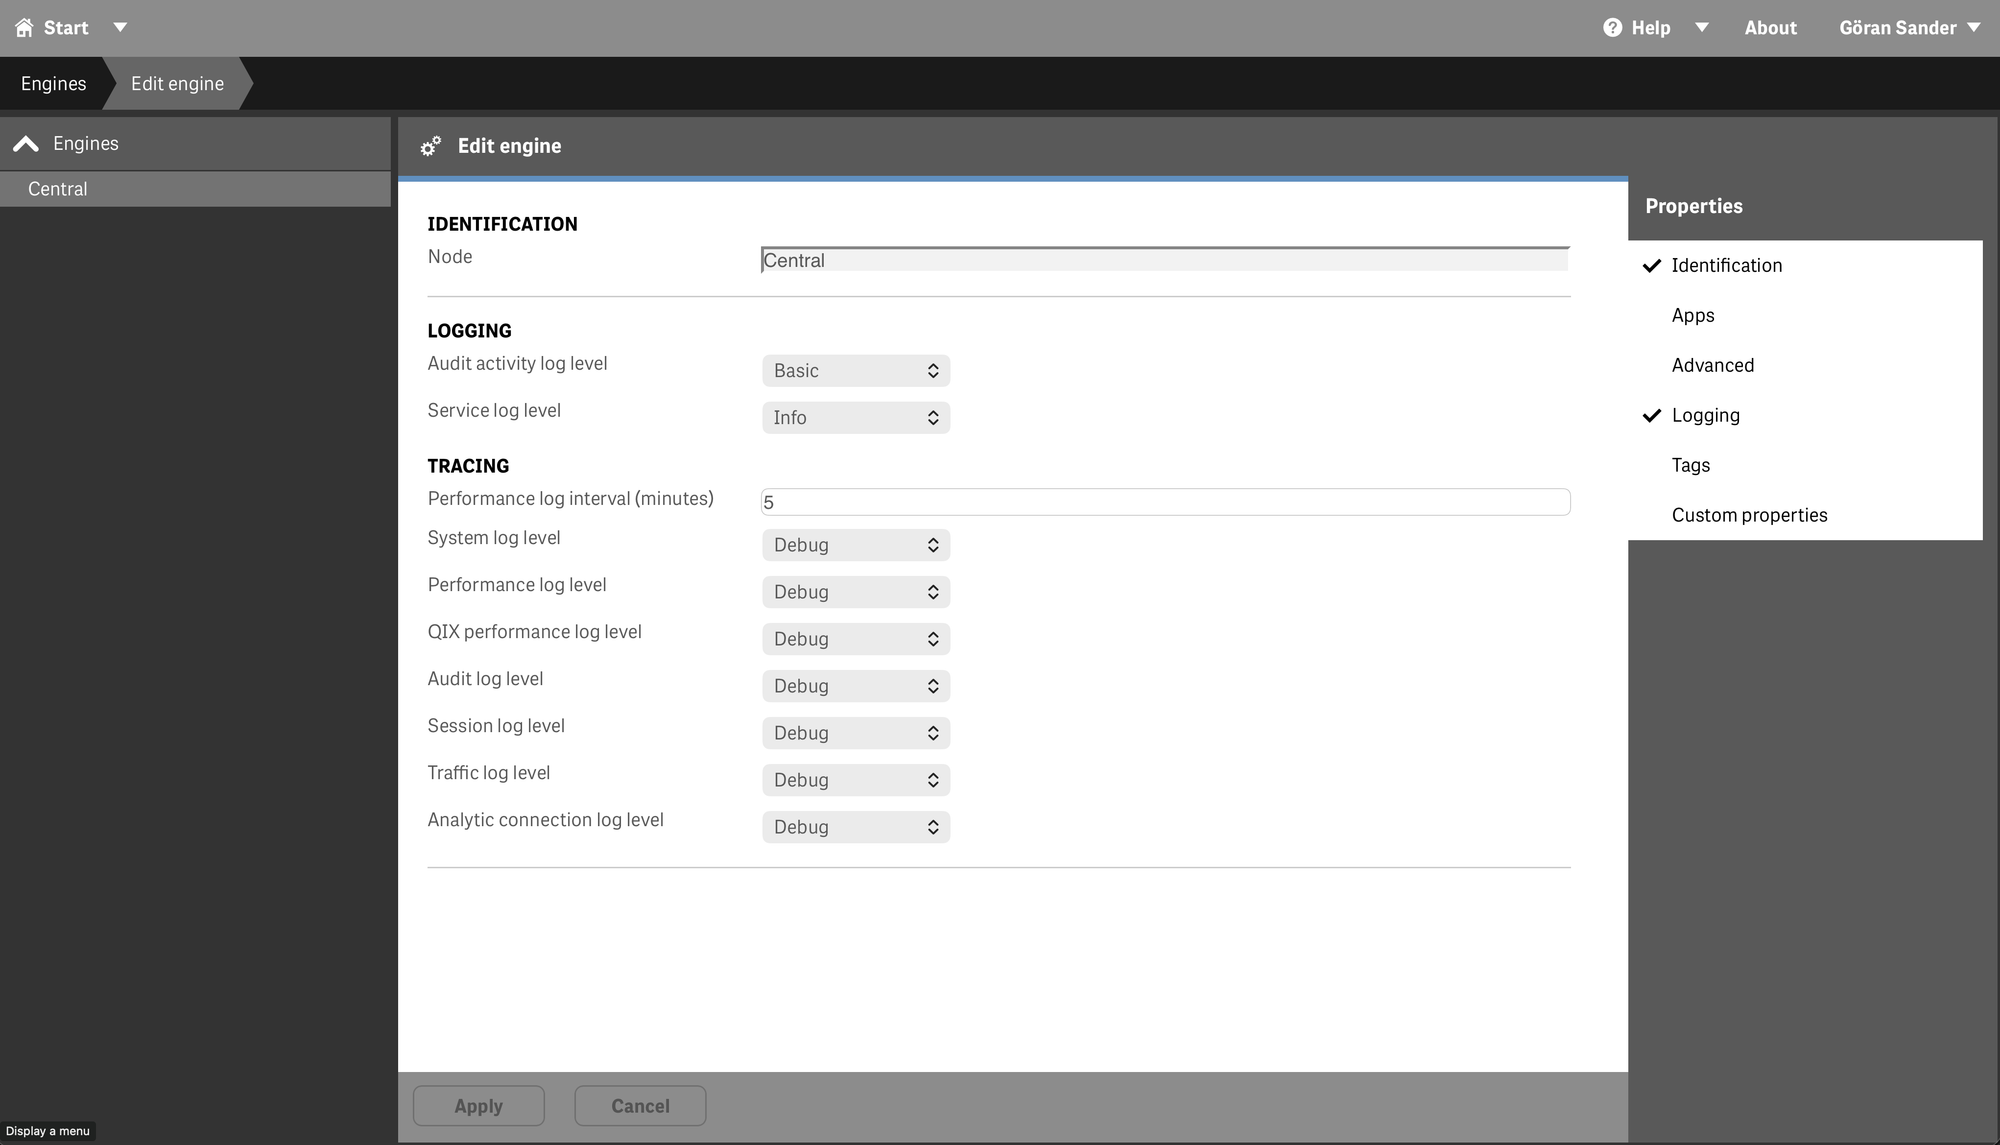
Important 2: the configured log level matters
The UDP messages emitted by Qlik Sense follow the log level configured in the QMC for each service.
If the log level for a service is set to INFO, there will be no DEBUG udp messages sent.
This may sound obvious, but it’s a very practical constraint when you’re trying to build monitoring based on log events: if you don’t collect DEBUG, you can’t alert on DEBUG-only signals.
Subsystems: the key to understanding what you can monitor
Each UDP log message originates from a specific logging subsystem (Qlik calls it the logger name — it’s the "%logger" part of the Log4Net pattern).
qs-log-scanner groups incoming messages by:
- Source (which service/appender emitted the UDP event)
- Subsystem (logger name)
For each (source, subsystem) it tracks:
- Message count
- Sender IPs
- Log levels seen
This gives you a practical map of what signals exist and where they come from.
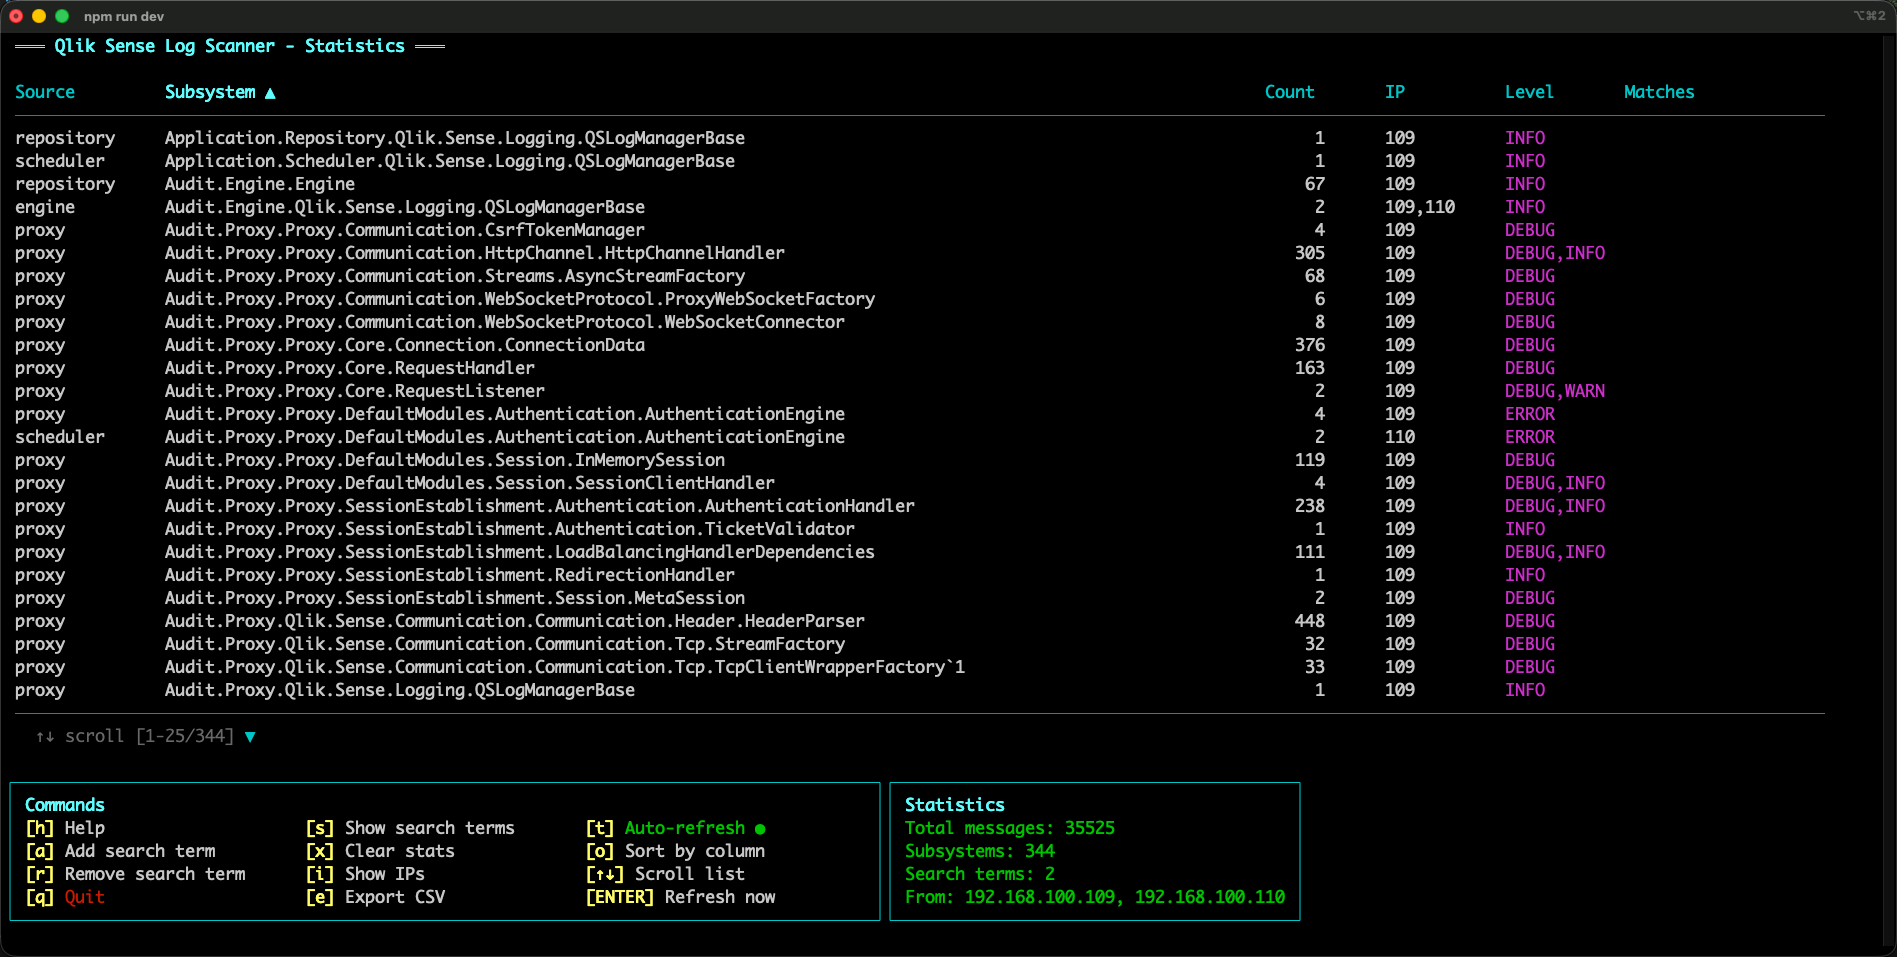
A quick example: after sorting by count, it becomes obvious that a small set of subsystems dominates the message volume.
This is an important insight, as it also tells us that the log files on disk will become large if setting logging to DEBUG for these subsystems.

Test environment
In preparation for this text, qs-log-scanner ran for a few hours in a small Sense environment:
- 2 nodes (one central + one rim)
- No failover configured
- “Normal” usage: some reloads (failing and succeeding), apps opened, general activity
During that time, the tool captured 344 different subsystems.
The full list is available in the GitHub repository.
There are likely more subsystems that can generate messages — they just weren’t triggered in that particular time window.
The UDP appender
In order to capture UDP messages, Qlik Sense services must be configured to send them. This is described in the Qlik Sense documentation.
Here is the XML appender "LocalLogConfig.xml" that was deployed on the two Sense servers during the capture. Note that this file needs to go into all the service folders that should emit UDP logs (e.g. "C:\ProgramData\Qlik\Sense\Scheduler\" for the Scheduler service).
The IP address and port should point to the machine running qs-log-scanner.
<?xml version="1.0" encoding="UTF-8"?>
<configuration>
    <!-- Generic appender for ALL messages -->
    <appender name="Event_root" type="log4net.Appender.UdpAppender">
        <param name="remoteAddress" value="192.168.3.250" />
        <param name="remotePort" value="9999" />
        <param name="encoding" value="utf-8" />
        <layout type="log4net.Layout.PatternLayout">
            <converter>
                <param name="name" value="rownum" />
                <param name="type" value="Qlik.Sense.Logging.log4net.Layout.Pattern.CounterPatternConverter" />
            </converter>
            <converter>
                <param name="name" value="hostname" />
                <param name="type" value="Qlik.Sense.Logging.log4net.Layout.Pattern.HostNamePatternConverter" />
            </converter>
            <converter>
                  <param name="name" value="longIso8601date" />
                  <param name="type" value="Qlik.Sense.Logging.log4net.Layout.Pattern.Iso8601TimeOffsetPatternConverter" />
            </converter>
            <converter>
                  <param name="name" value="user" />
                  <param name="type" value="Qlik.Sense.Logging.log4net.Layout.Pattern.ServiceUserNameCachedPatternConverter" />
            </converter>
            <converter>
                  <param name="name" value="encodedmessage" />
                  <param name="type" value="Qlik.Sense.Logging.log4net.Layout.Pattern.EncodedMessagePatternConverter" />
            </converter>
            <converter>
                  <param name="name" value="encodedexception" />
                  <param name="type" value="Qlik.Sense.Logging.log4net.Layout.Pattern.EncodedExceptionPatternConverter" />
            </converter>
            <param name="conversionpattern" value="/scheduler/;%rownum{9999};%longIso8601date;%date;%level;%hostname;%logger;%user;%encodedmessage;%encodedexception;%property{UserDirectory};%property{UserId};%property{Command};%property{Result};%property{Origin};%property{Context}" />
        </layout>
    </appender>

    <!-- Root logger to catch as many messages as possible-->
    <root>
        <appender-ref ref="Event_root" />
    </root>

</configuration>
A couple of notes on the "conversionpattern" above:
- The first field (/scheduler/) is a useful “source hint” when you aggregate messages later.
- "%level" and "%logger" are the two fields that tell us what log level and subsystem the message originated from.
How this helps Butler and Butler SOS
Once you have a list of subsystems (and the log levels they appear on), you can make much better decisions about monitoring:
- Which messages are relevant to build monitoring and alerts on?
- Which subsystems are high-volume and might need filtering (or should be avoided)?
- Which services should be configured to emit UDP in the first place?
In other words: this kind of discovery work helps define what monitoring can (and cannot) be done in Butler and Butler SOS.
What’s next
The obvious next step is to take the discovered subsystems and identify:
- Candidate signals for monitoring
- Which ones correlate with real operational problems?
- What log levels are required to catch them?
If you try qs-log-scanner in your own environment and you see interesting subsystems (or want to share a “top 20” list), I’d love to hear about it — especially if you run different services, extensions, auth methods, or have a clustered/failover setup.
Either in the comments here or over at GitHub.
Open source / GitHub
qs-log-scanner is open source and available on GitHub: