Visualise Qlik Sense reload tasks using Ctrl-Q
Ctrl-Q lets you visualise Qlik Sense task dependencies as trees or - as of Ctrl-Q 3.15 - network graphs! This gives an unprecedented overview of complex task chains in any Qlik Sense Enterprise environment.

Ctrl-Q includes a feature to show task dependencies in a tree structure, similar to how Qlikview did things long ago.
This can be useful to see which downstream task dependencies a specific task has, and is a huge improvement over the task viewer that's included in the QMC.
Task trees do however not (easily) capture multiple upstream task dependencies, nor does task trees deal with circular dependencies well.
Latest version of Ctrl-Q (3.15) address this by adding another way of visualising task dependencies: Network graphs.
File paths may look a little different on Windows, but that's about it.
Starting up
Let's take a look at what Ctrl-Q can do.
When starting Ctrl-Q with the task-vis command, Ctrl-Q will spin up a web server that serves a web page with the network graph in it.
The command looks like this (assuming Sense certificates are stored in the ./cert folder):
➜  ctrl-q demo ./ctrl-q task-vis --host 10.11.12.13 --auth-type cert --auth-user-dir QSUSERDIR --auth-user-id goran
2024-01-15T08:54:13.463Z info: -----------------------------------------------------------
2024-01-15T08:54:13.464Z info: | Ctrl-Q
2024-01-15T08:54:13.464Z info: |
2024-01-15T08:54:13.464Z info: | Version      : 3.15.0
2024-01-15T08:54:13.464Z info: | Log level    : info
2024-01-15T08:54:13.464Z info: |
2024-01-15T08:54:13.464Z info: | Command      : task-vis
2024-01-15T08:54:13.464Z info: |              : visualise task network
2024-01-15T08:54:13.464Z info: |
2024-01-15T08:54:13.465Z info: | Run Ctrl-Q with the '--help' option to see a list of all available options for this command.
2024-01-15T08:54:13.465Z info: |
2024-01-15T08:54:13.465Z info: | https://github.com/ptarmiganlabs/ctrl-q
2024-01-15T08:54:13.465Z info: ----------------------------------------------------------
2024-01-15T08:54:13.465Z info:
2024-01-15T08:54:15.187Z info: Using vis.js to visualize tasks, more info at https://github.com/visjs/vis-network
2024-01-15T08:54:15.187Z info:
2024-01-15T08:54:15.187Z info: Task visualization server listening on http://localhost:3000
2024-01-15T08:54:15.187Z info: Press Ctrl-C to quit.
Note the second last row above: Ctrl-Q is listening on http://localhost:3000.
I.e. port 3000 on the computer where Ctrl-Q was started.
The address and port where the task visualisation web page is available can be customised via the `--vis-host` and `--vis-port` parameters.
If your certificate files are stored elsewhere you need to specify their location via the `--auth-cert-file` and `--auth-cert-key-file` parameters.
Or use JWT authentication.
You always get help for all Ctrl-Q commands by adding the --help parameter:
➜  ctrl-q demo ./ctrl-q task-vis --help
Usage: build task-vis [options]

visualise task network

Options:
  --log-level <level>           log level (choices: "error", "warn", "info", "verbose", "debug", "silly", default: "info")
  --host <host>                 Qlik Sense server IP/FQDN
  --port <port>                 Qlik Sense repository service (QRS) port (usually 4242 for cert auth, 443 for jwt auth) (default: "4242")
  --virtual-proxy <prefix>      Qlik Sense virtual proxy prefix (default: "")
  --auth-user-dir <directory>   user directory for user to connect with
  --auth-user-id <userid>       user ID for user to connect with
  -a, --auth-type <type>        authentication type (choices: "cert", "jwt", default: "cert")
  --auth-cert-file <file>       Qlik Sense certificate file (exported from QMC) (default: "./cert/client.pem")
  --auth-cert-key-file <file>   Qlik Sense certificate key file (exported from QMC) (default: "./cert/client_key.pem")
  --auth-root-cert-file <file>  Qlik Sense root certificate file (exported from QMC) (default: "./cert/root.pem")
  --auth-jwt <jwt>              JSON Web Token (JWT) to use for authentication with Qlik Sense server
  --vis-host <host>             host for visualisation server (default: "localhost")
  --vis-port <port>             port for visualisation server (default: "3000")
  -h, --help                    display help for command
Overview and details
Sometimes you want the big picture, looking at the major task chains that make up your Qlik Sense environment.
Other times you may want to investigate in detail which order tasks execute in.
The network graphs let you do both.
Zooming out and/or cluster tasks into groups provides overview, while zooming in gives both task status and other task info.
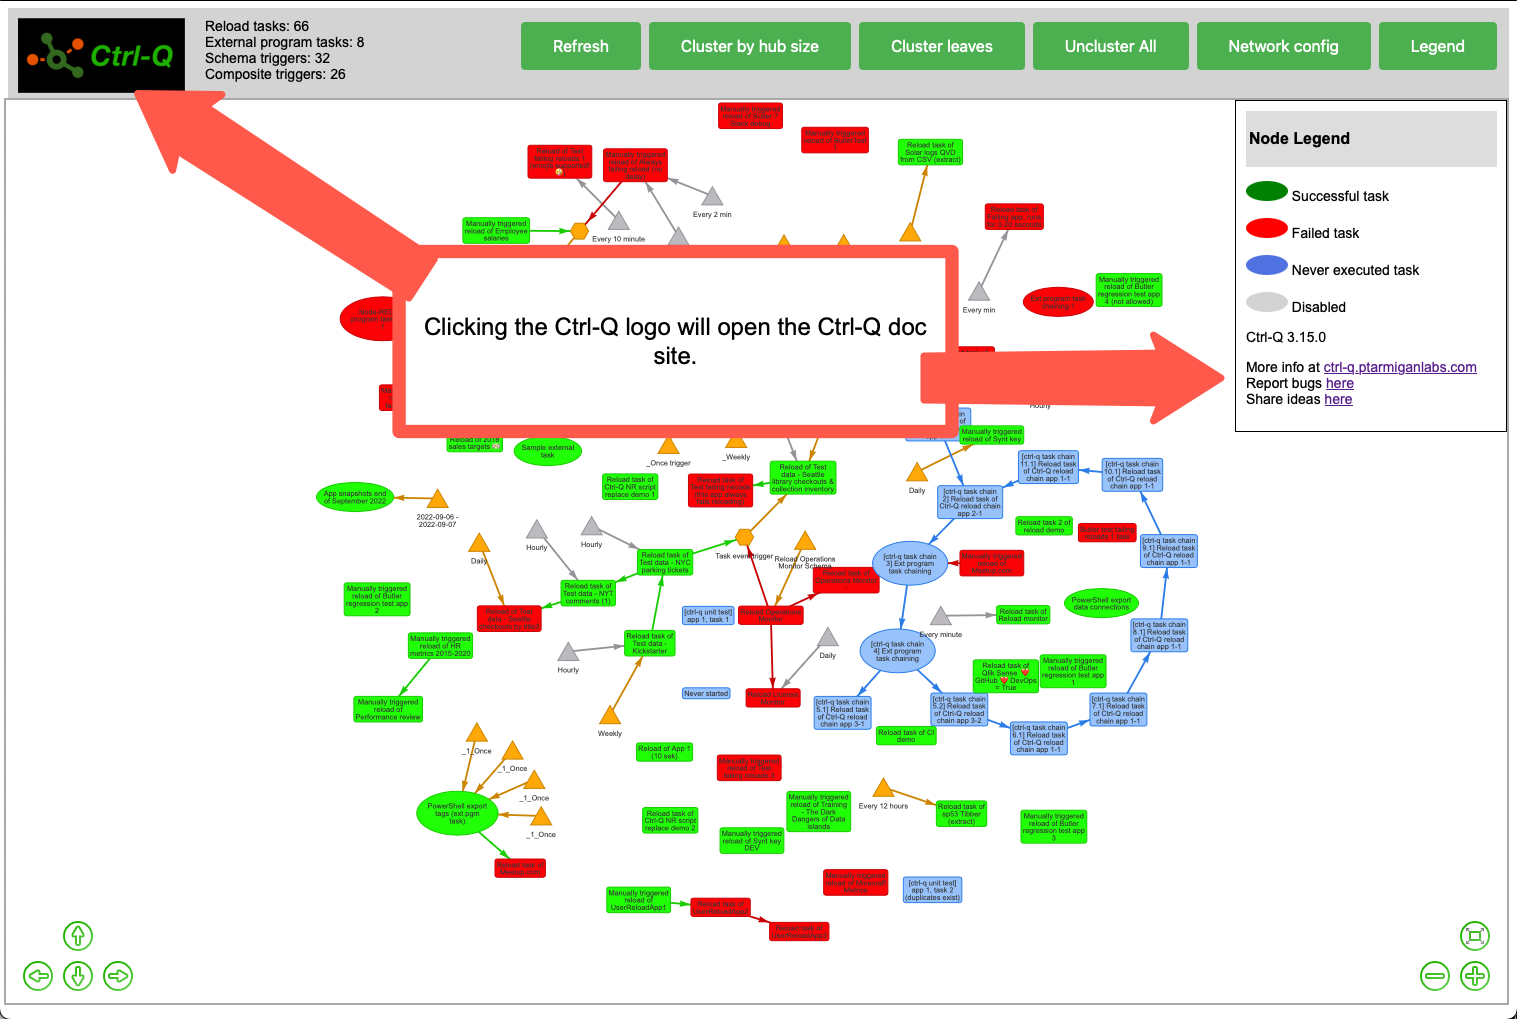
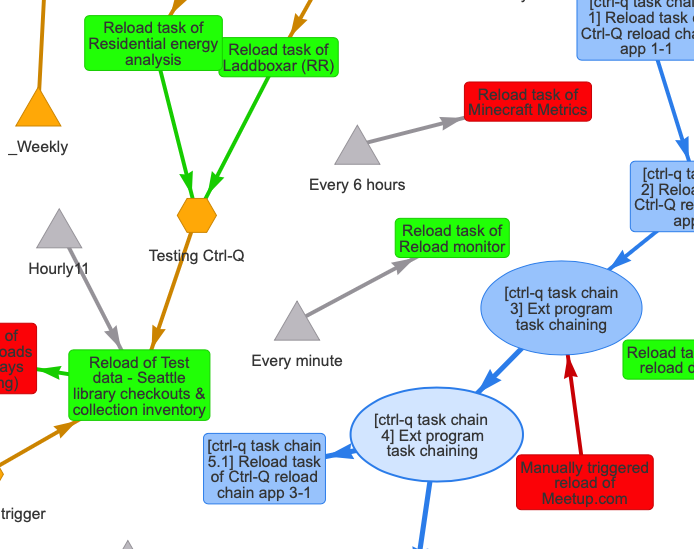
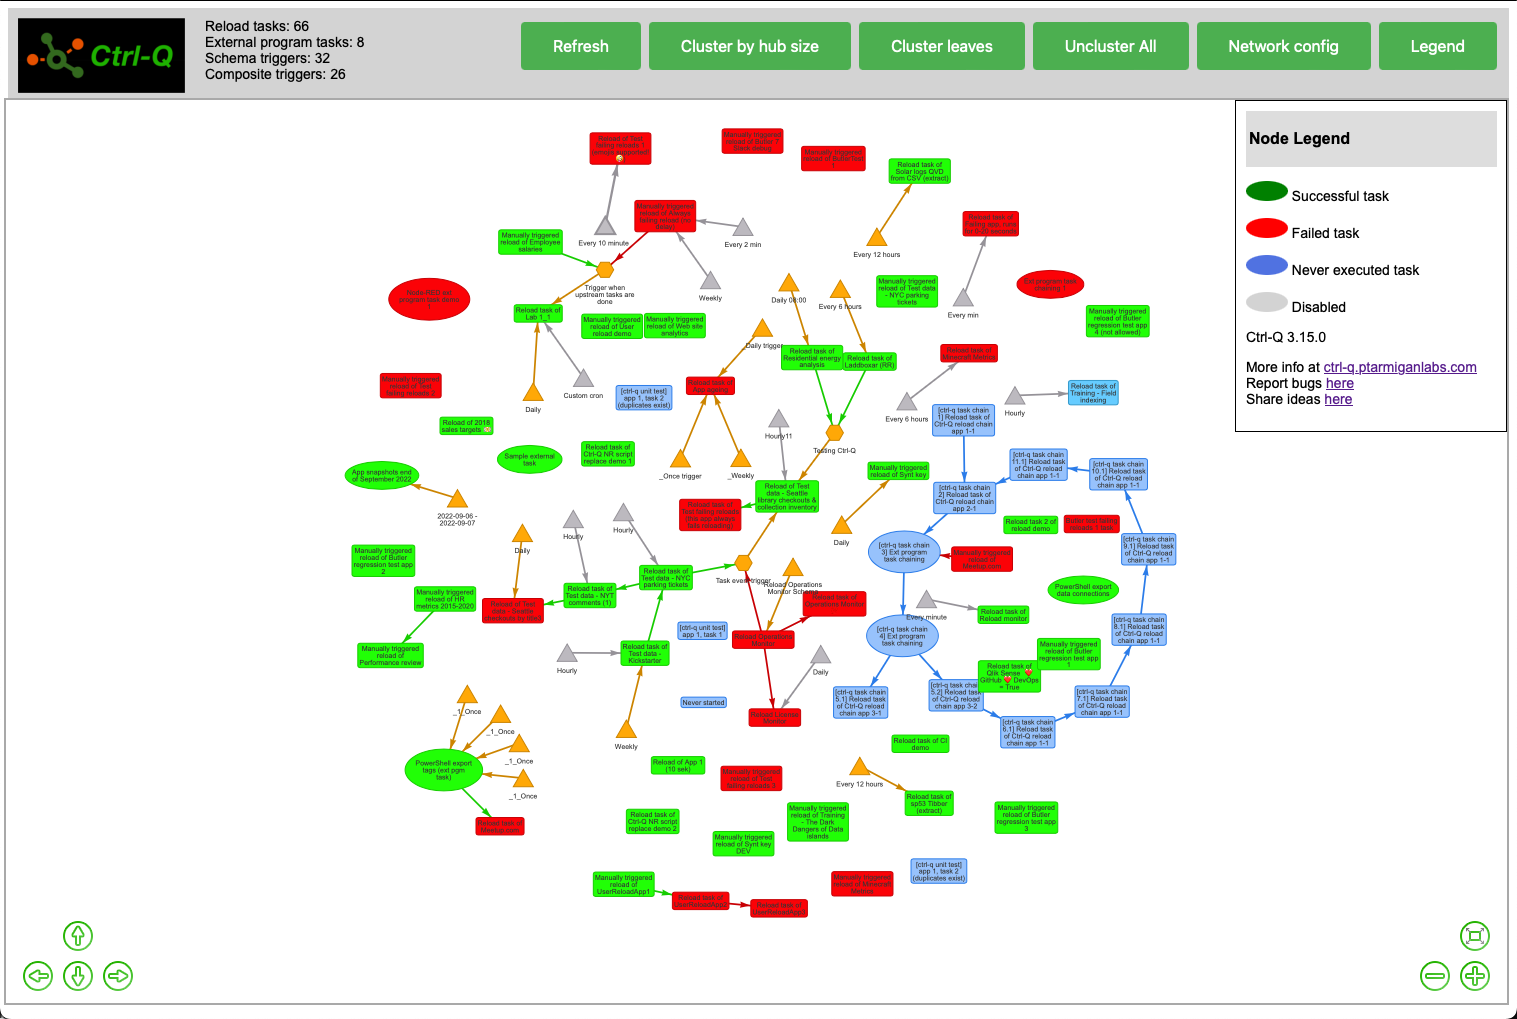
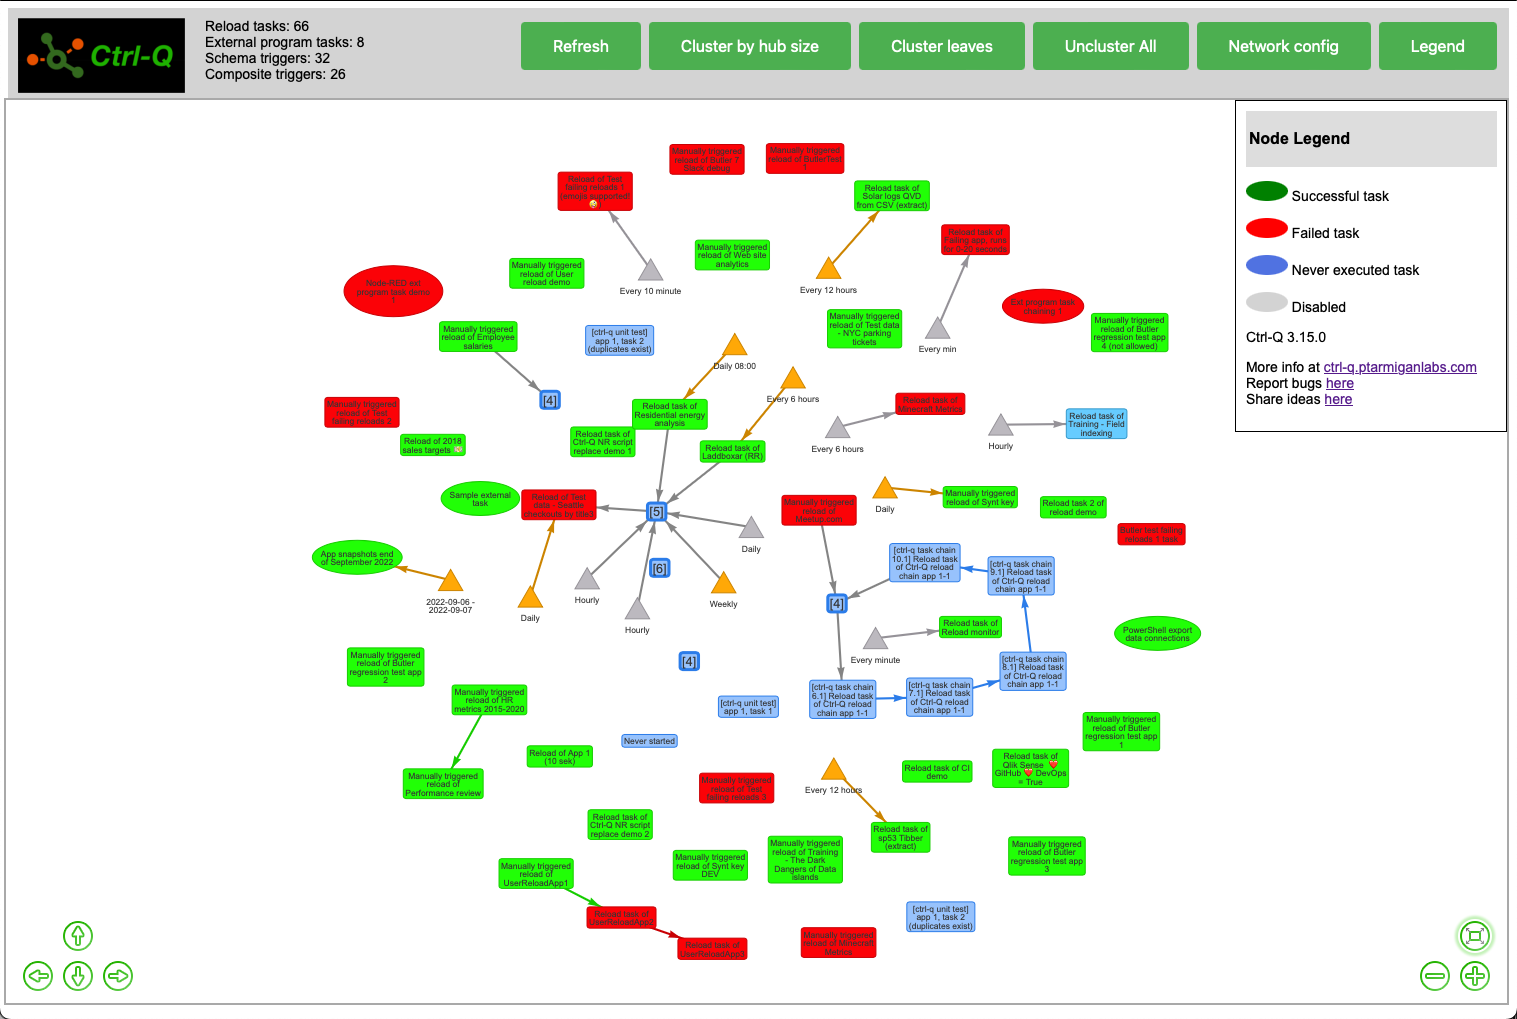
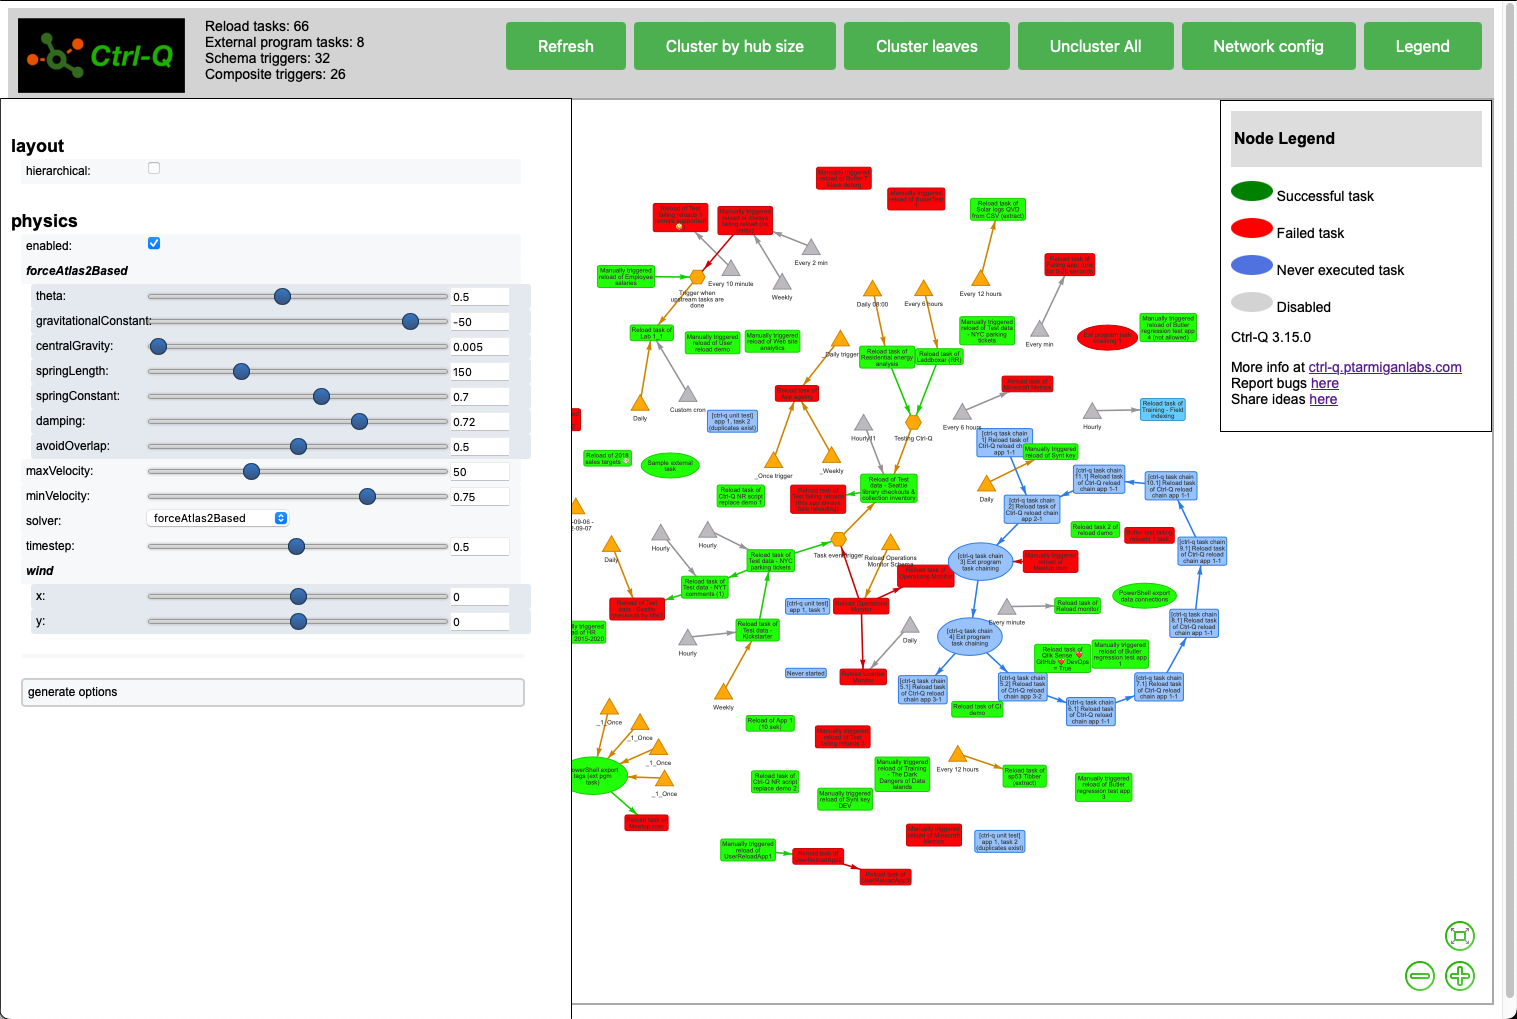
Understanding the network icons
The network graph uses icons and colors to represent tasks and their states.
The icons/shapes are
- Rectangle: A Qlik Sense reload task.
- Ellipse: A Qlik Sense external program task.
- Triangle: A schema trigger.
- Hexagon: A composite trigger.
Colors are used as follows:
- Blue: Never started task.
- Green: Last execution of task was successful.
- Red: Last execution of task failed
- Orange: Trigger is enabled.
- Grey: Trigger is disabled.
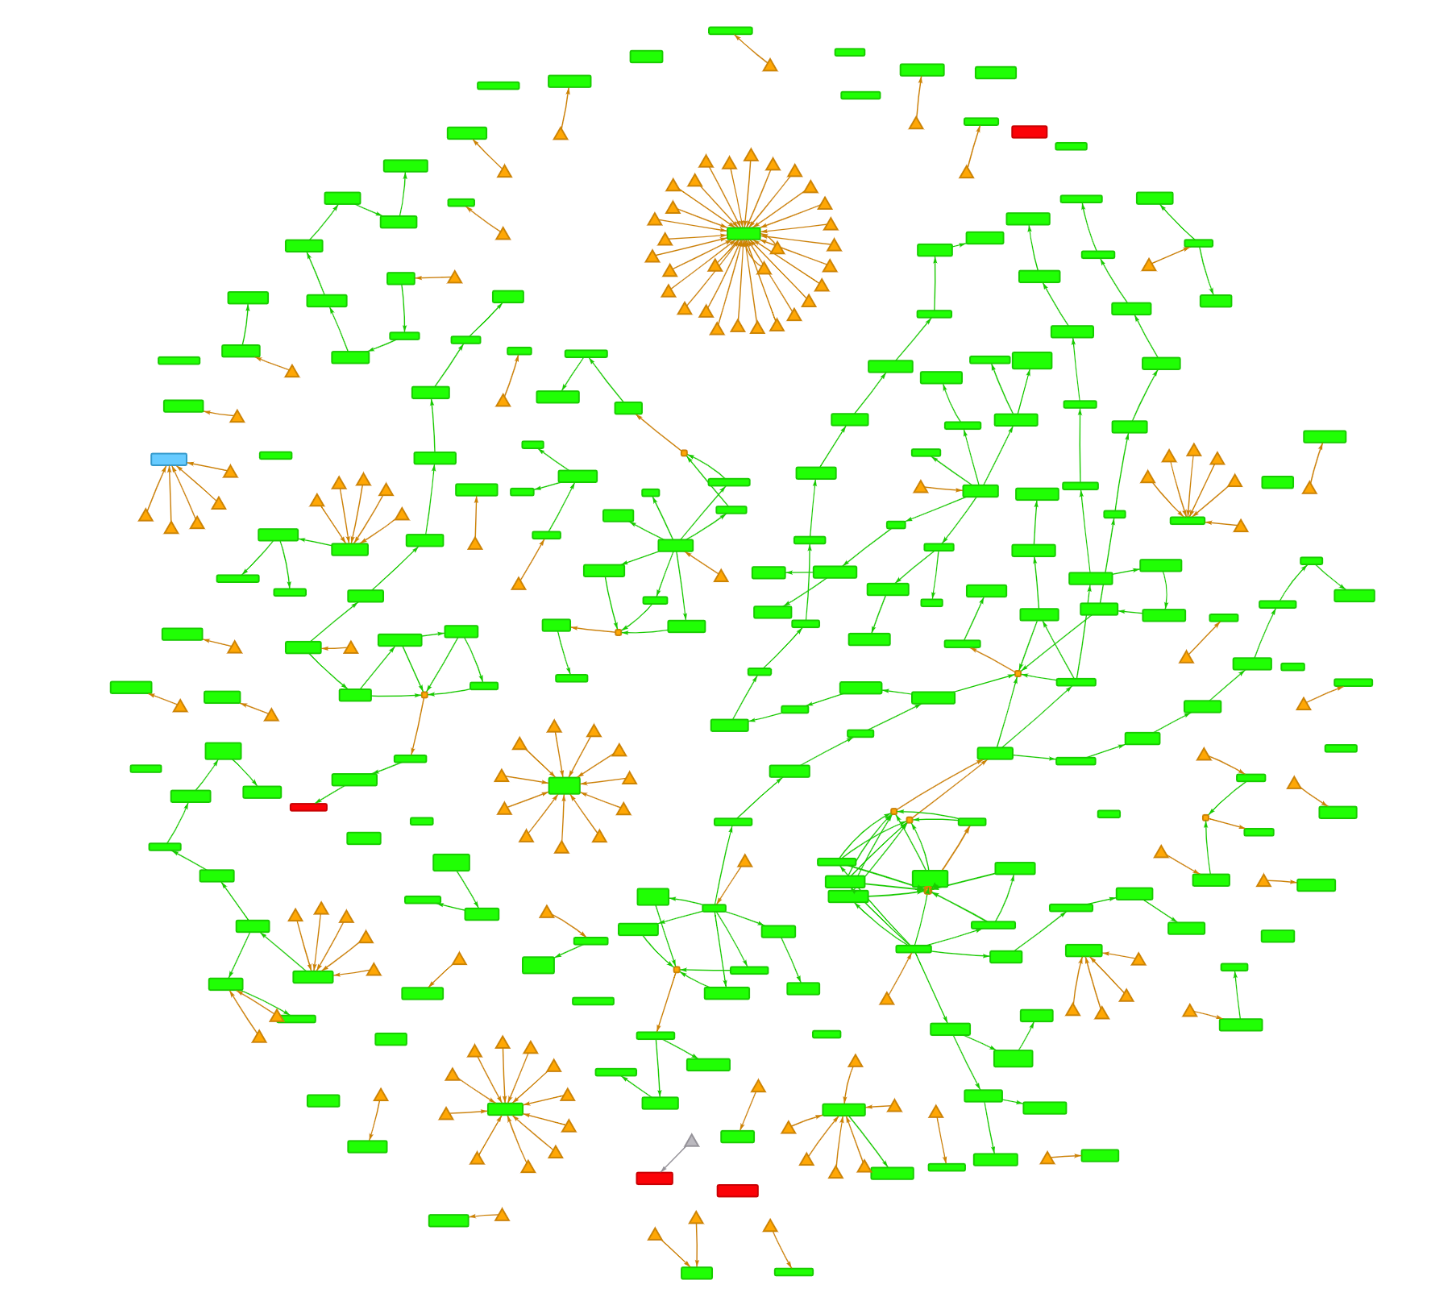
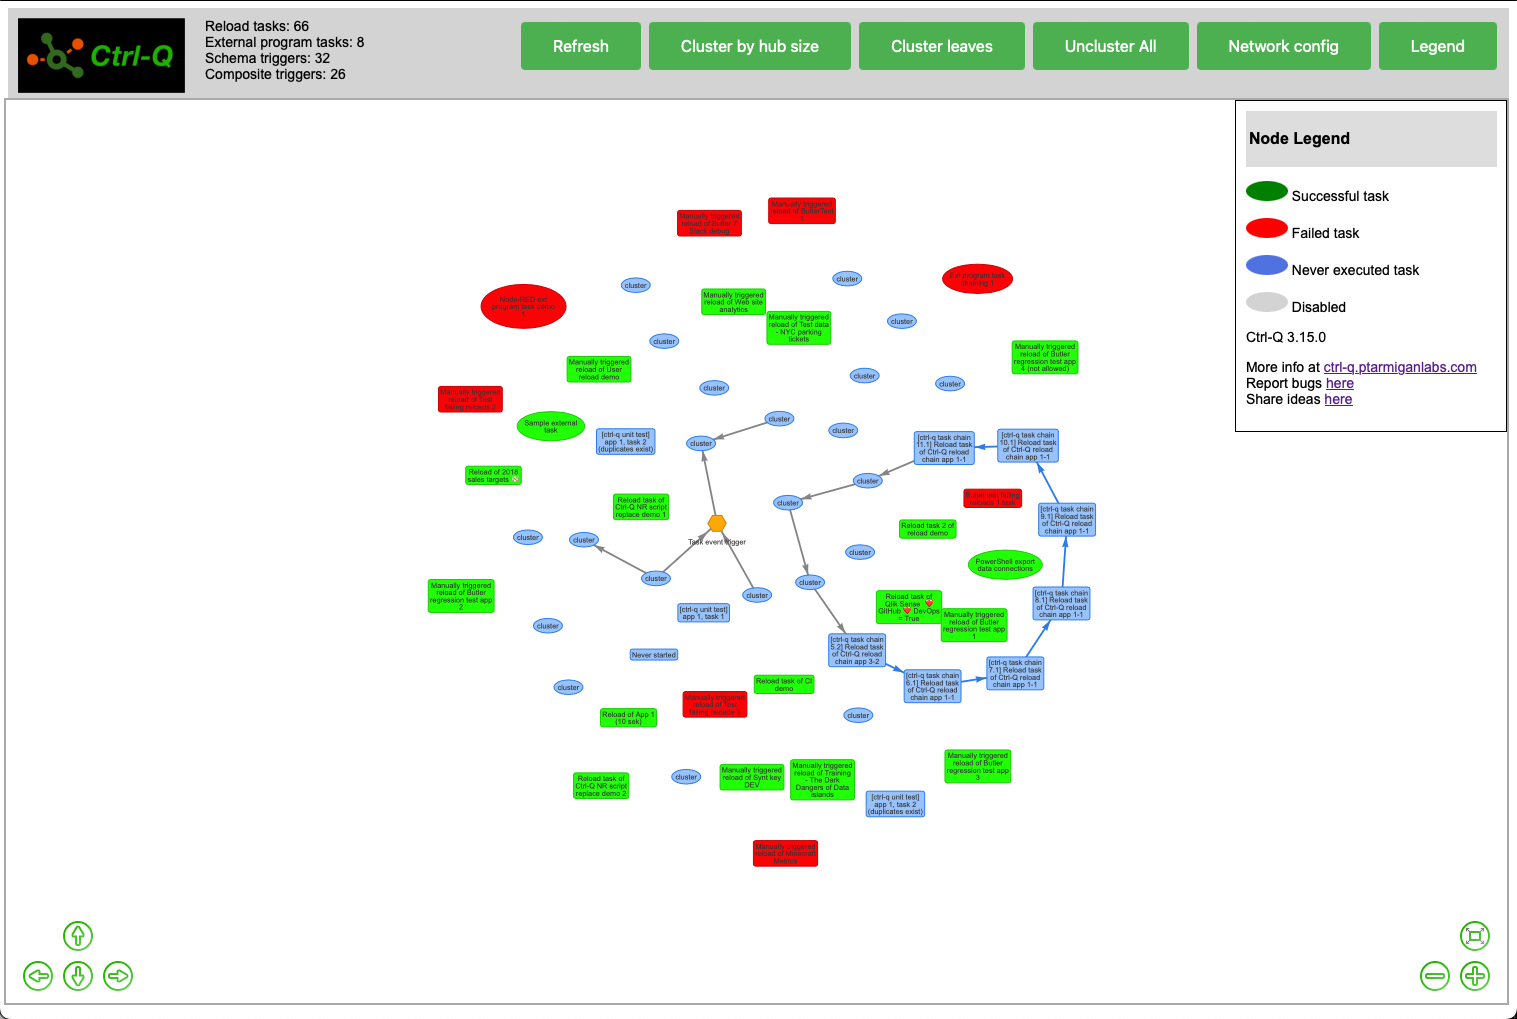
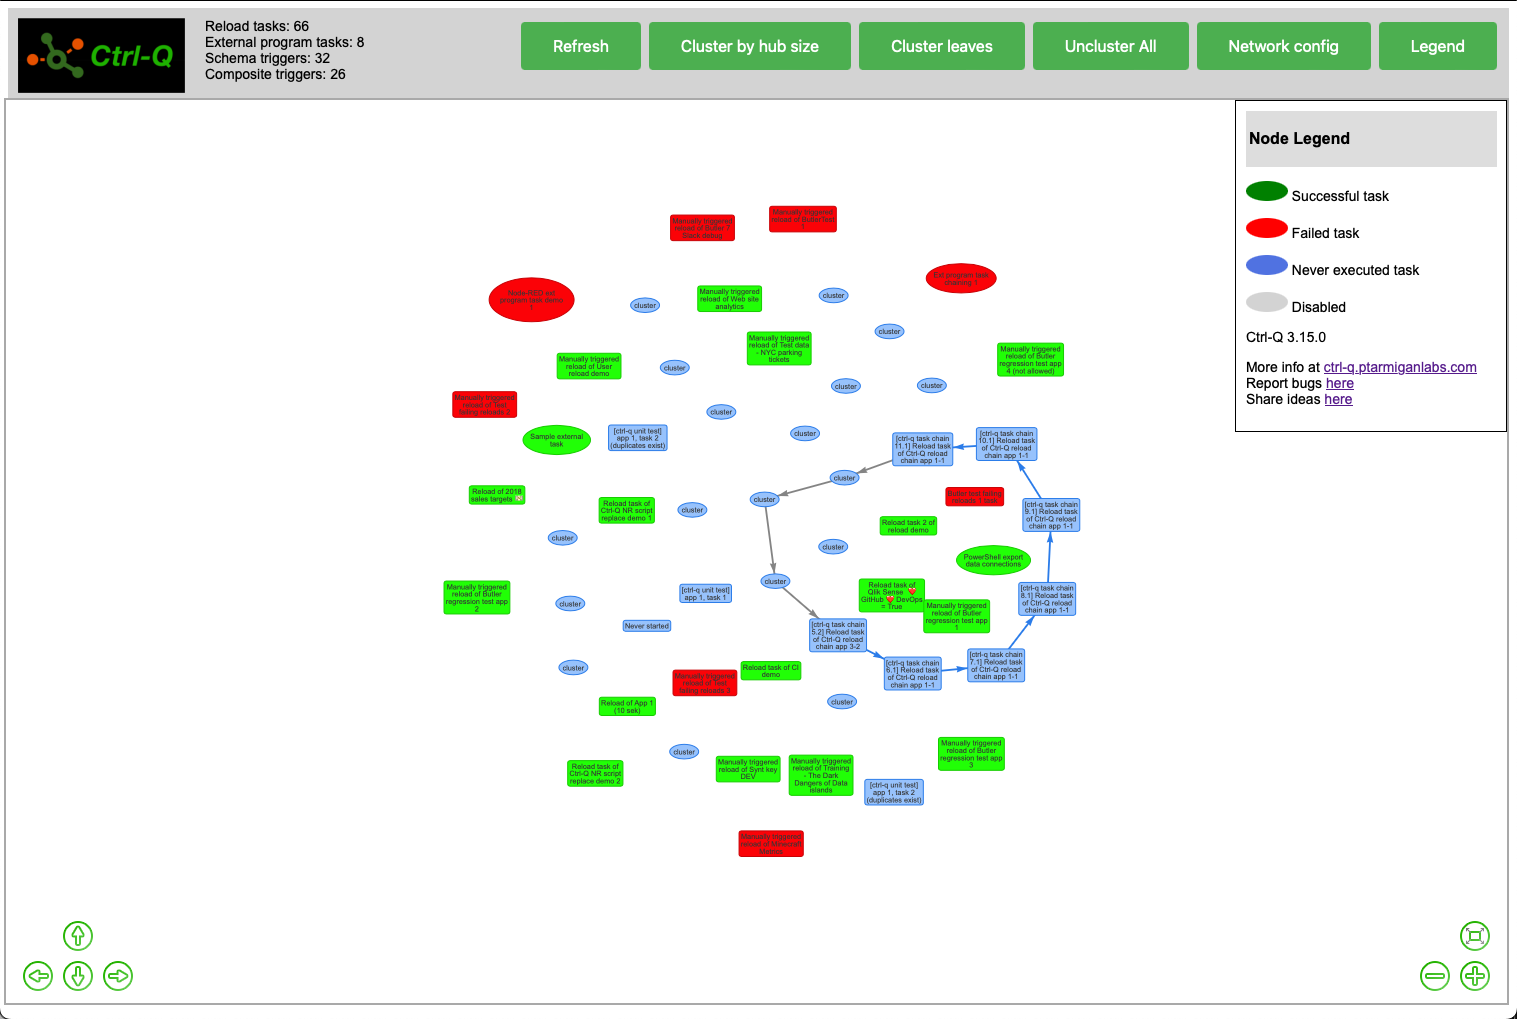
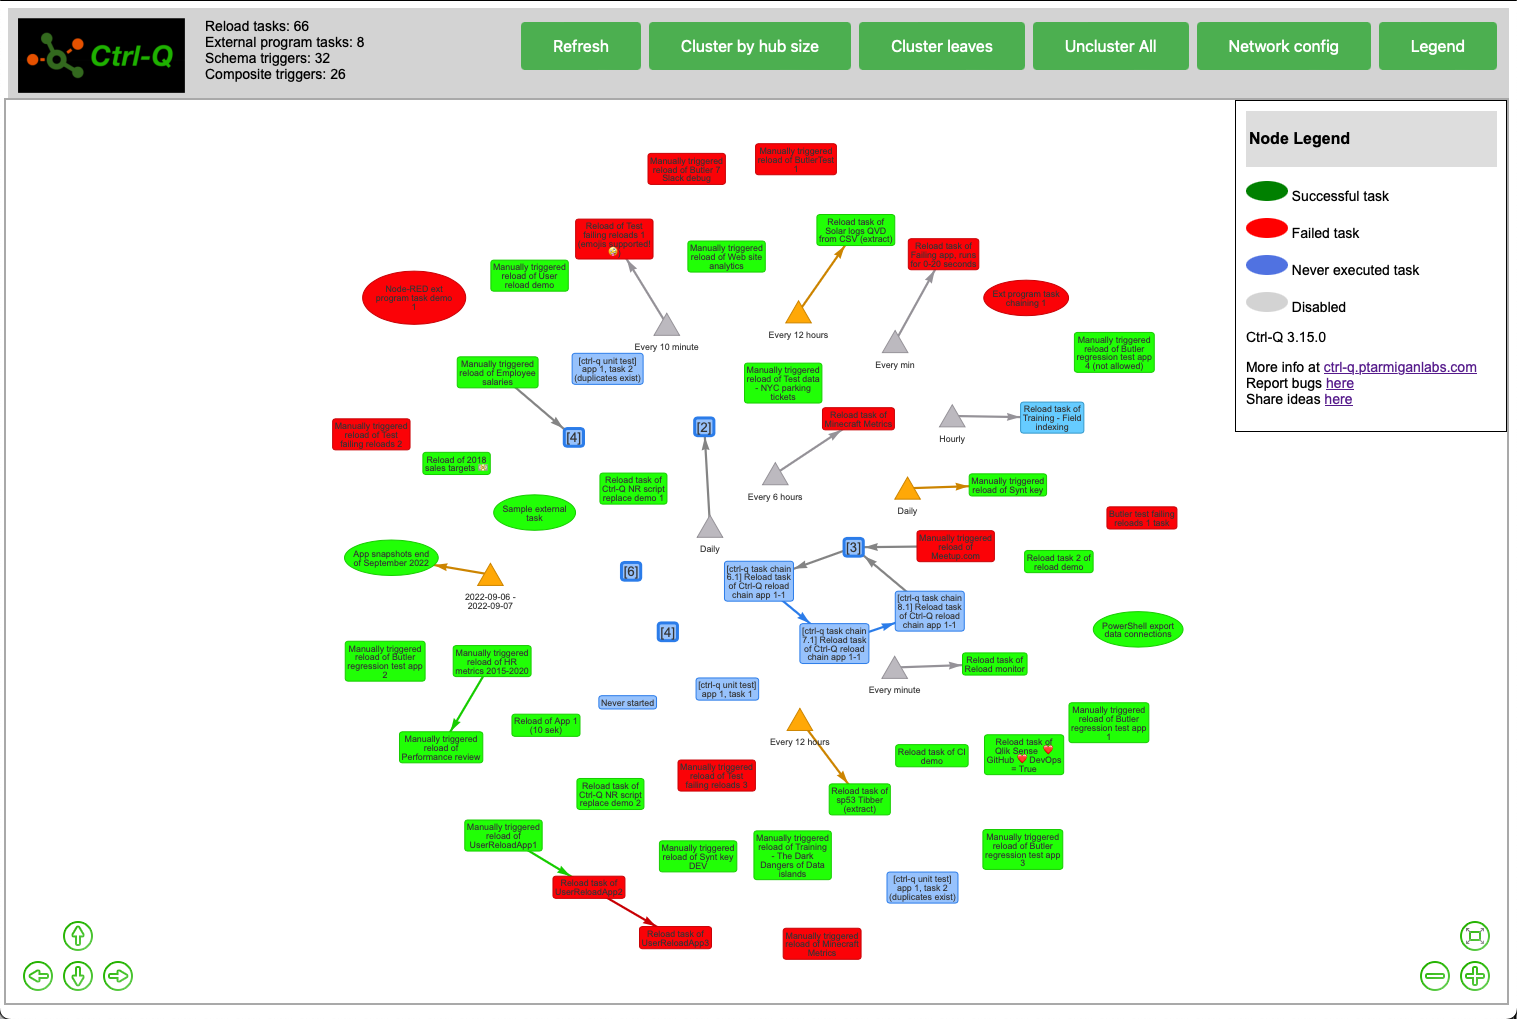
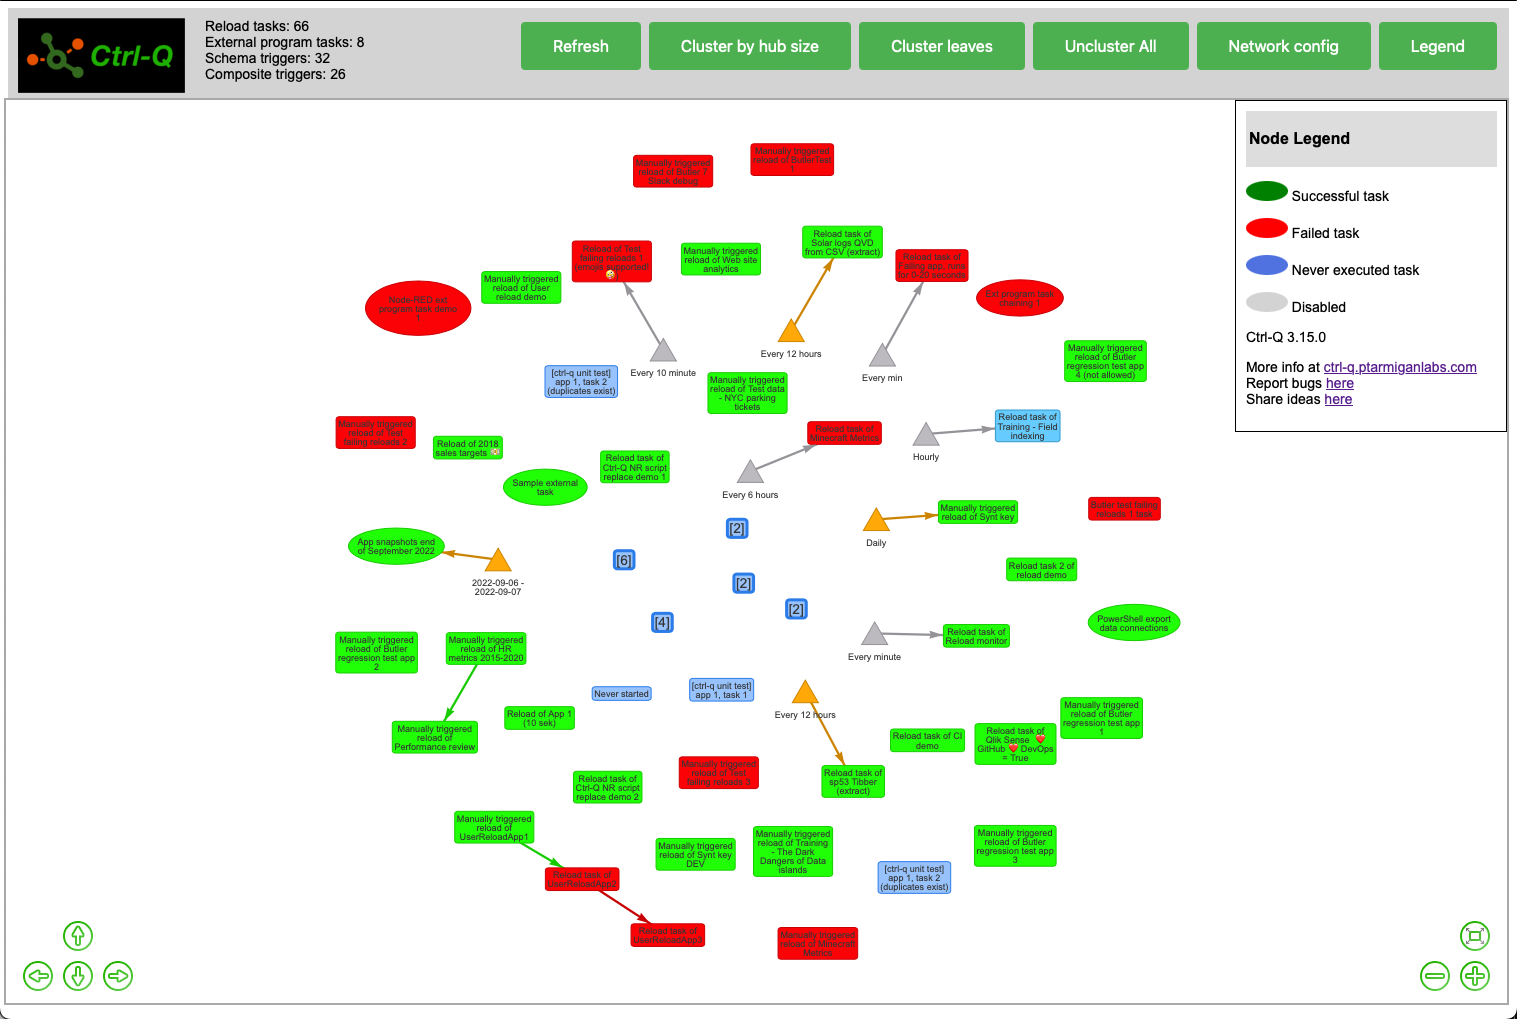
Getting the big picture: Clustering
If there are lots of tasks the network can become rather cluttered.
Clustering can then be used to give a better overview of the tasks.
There are two kinds of clustering:
- "Cluster leaves" will hide all leave nodes in the graph.
- "Cluster by hub size" will look at what nodes have most connections and then group those nodes into clusters.
Both clustering options can be used repeatedly, resulting in an increasingly abstract view of the network dependencies.
Which clustering is best depends on the situation and what you try to achieve - experiment with them to see what works best in each occasion.
👉 Clicking on a cluster will expand it, revealing the tasks (or clusters) within.
👉 Clicking the "Refresh" button at the top will reset the network to its original state.
Example: Cluster leaves
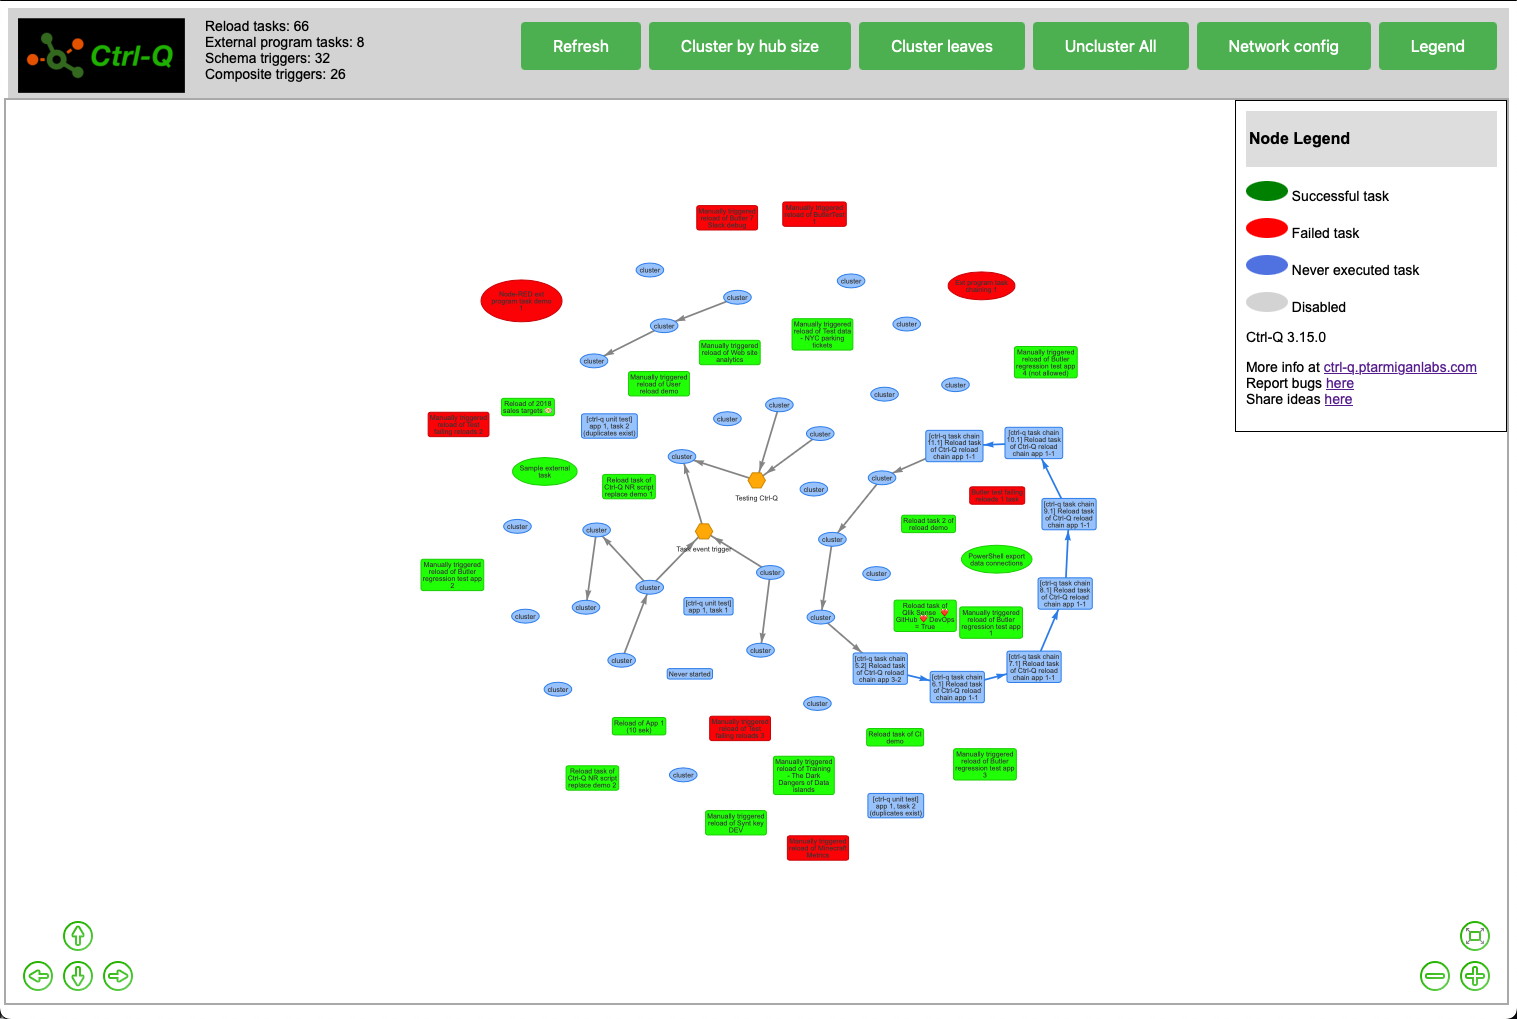

Example: Cluster by hub size

Zooming in
Zooming in/out, panning and re-centering the network can be done via the on-screen buttons (lower left/right corners).
Additionally, zooming in/out can be done using the mouse wheel.
Panning is done by left-clicking-dragging on the network's background.
Clicking-moving a network node will move it (and other nodes, depending on the network's current physics settings).
Starting over
Clicking the "Refresh" button will reset the network to it's original state (all nodes visible), but it will not trigger an update of the tasks from Qlik Sense.
To get the latest tasks and their respective states Ctrl-Q has to be restarted.
Hit ctrl-c to exit Ctrl-Q, then start it again to load latest task states from Qlik Sense.
Adjusting network settings
The network graph uses a physics engine to determine how to layout the various network nodes.
The parameters of this engine can be edited by clicking the "Network config" button in the toolbar. If things get too strange you can always hit "Refresh" in the toolbar to reset the network to its original state.
Performance considerations
Showing the task network is an all-or-nothing thing when it comes to which tasks to get from Qlik Sense. In other words, Ctrl-Q will get information about ALL tasks from Qlik Sense. For large Sense environments this may take a while and put some load on the repository service.
This is usually not a problem, but still something to be aware of.
Clicking the "Refresh" button will only refresh the in-browser network graph - no new data will be retrieved from Qlik Sense.
Getting help
Are you stuck and could use some help?
Found a bug?
Click the Ctrl-Q log in upper left corner, or the link shown in the legend to open https://ctrl-q.ptarmiganlabs.net in a new browser tab.
Report bugs and share ideas by clicking those respective links in the legend - this will open the Ctrl-Q GitHub repository in a new tab.