
On this page
Earlier this week I wrote about the Onboard.qs demo apps: two Qlik Sense apps, one English and one Swedish, showing guided tours doing two jobs — walking new users around an app, and telling them what the numbers say.
There is a third app, and it didn't make that post. It's the one in the video at the top of the Onboard.qs README, and it has now gone into the repository alongside the other two, as Onboard.qs demo Coffee (EN).
Ptarmigan Coffee is a made-up speciality roastery in Gothenburg. It buys green coffee from ten origins and pours it in ten Nordic cafés. The app exists to make one point: a tour step doesn't have to be a paragraph of text. It can be a stat card, a ranking, a row of bars — all worked out from the data model while the tour runs.
Seventy seconds tells the story:
Take the app for a spin. The coffee app is a free .qvf download. Import it in the QMC under Apps, with the free Onboard.qs extension (1.9.0 or later) installed. The load script generates its own data, so there is nothing to connect and nothing to reload. Open sheet 1 and the welcome tour starts by itself.
What's in the app
Three sheets, five tours between them:
| Sheet | What's on it | Tours |
|---|---|---|
| 1. From farm to cup | A map with the origins, their sea routes and the cafés, four KPIs, and green coffee by origin | Welcome: find your way around (starts by itself), Coffee by the numbers, Origin profiles |
| 2. Origins | Quality against price, where the coffee comes from, and a table of origin profiles | Reading the origins |
| 3. Cafés | Cups per month, café revenue, cups by country and by café | The cafés |
The business behind it: 285 tonnes of green coffee from ten origins on three continents, 2.28 million cups poured in ten cafés in four countries, from November 2024 to October 2026. The load script generates all of it, so the app needs no data connection and nothing to reload. A sine hash stands in for Rand(), which can't be seeded, so every reload gives the same figures — handy when the tour texts quote them.
Tours that read like infographics
The second step of Coffee by the numbers is a ranking of the origins beside the chart that ranks them:
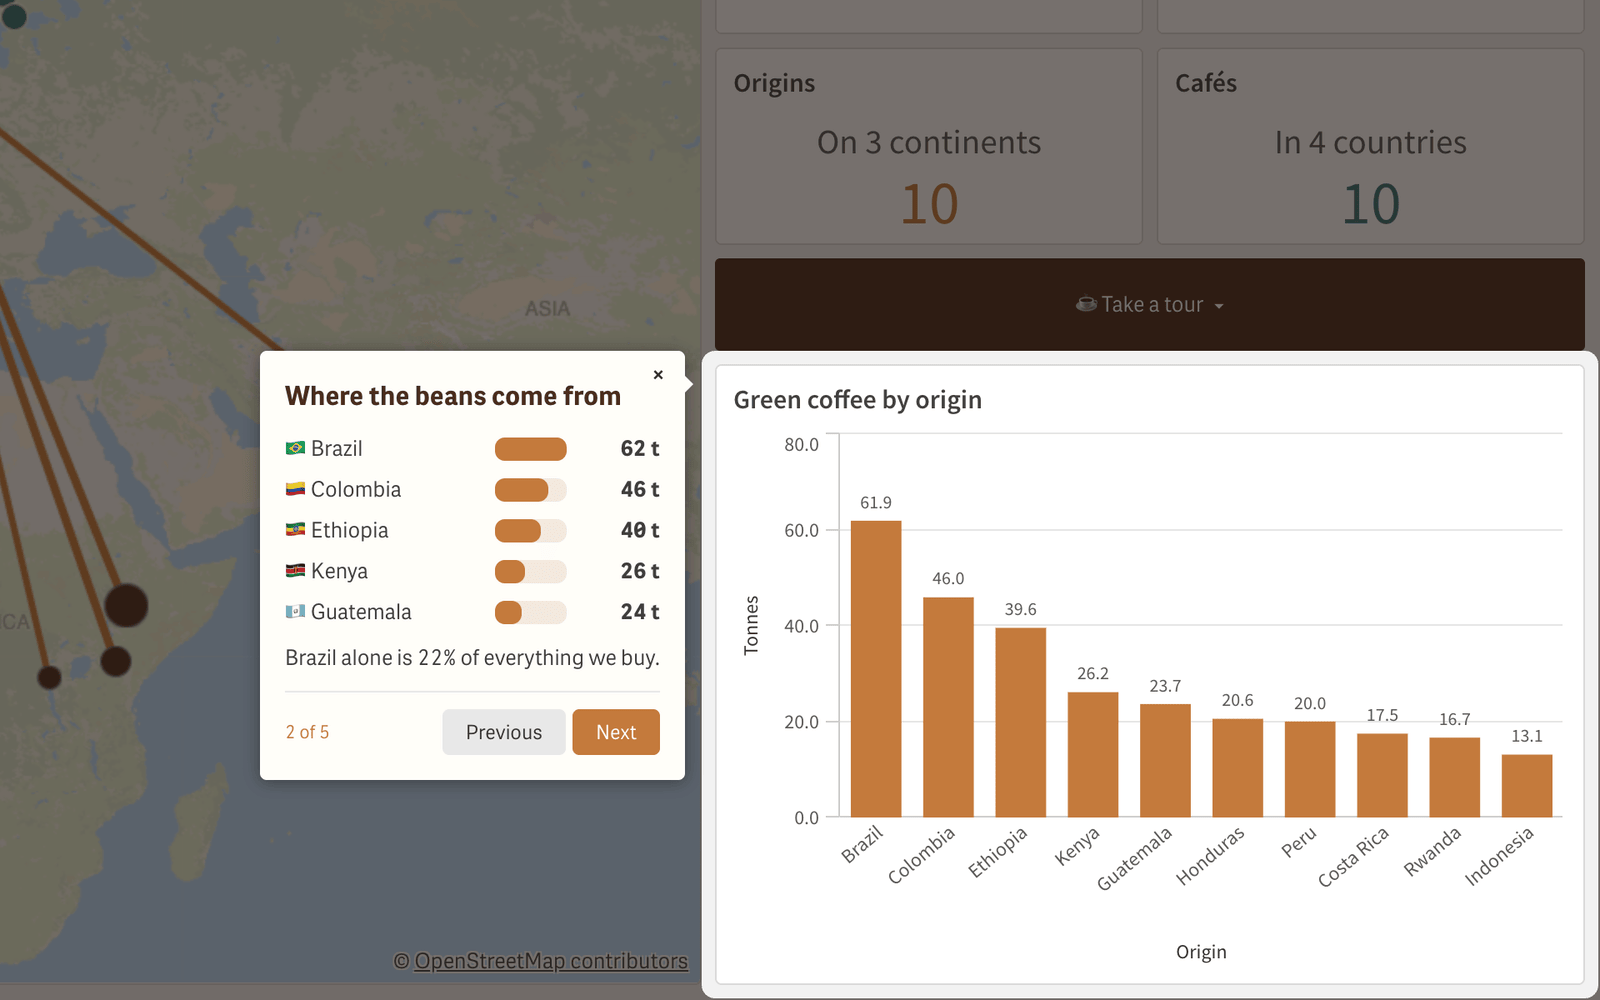
Nothing in that step is typed. The flags, the names, the bar widths and the tonnes come out of one Concat(Aggr(…)) expression that builds the HTML, and the sentence underneath is its tail:
FirstSortedValue(Origin, -Aggr(Sum(KgGreen), Origin)) & ' alone is ' &
Num(Max(Aggr(Sum(KgGreen), Origin)) / Sum(KgGreen), '0%') & ' of everything we buy.'
Brazil is at the top because Brazil is at the top today. A reload that changes the order changes the ranking, the bars, the tonnes and that closing sentence with it.
Step titles work the same way. The next step is called A 27-day voyage, where the 27 is the average time at sea, weighted by volume:
'A ' & Num(Sum(KgGreen * SeaDays) / Sum(KgGreen), '0') & '-day voyage'Its text then names the longest trip — Rwanda, at 38 days — by asking the data which one it is, rather than by remembering.
A step that follows what you click
The demo apps post ended with a list of things to watch out for, and the first was that a tour's expressions are worked out once, when the tour starts. Make a selection halfway through and the steps keep the figures they opened with.
That one is fixed. Onboard.qs 1.9.0 added a per-tour setting, Update expressions at each step (onboard.qs#280), and the coffee app's Origin profiles tour is a single step with it turned on, sitting on the map. With nothing selected it asks you to pick an origin. Click Ethiopia, and the step becomes Ethiopia's profile:
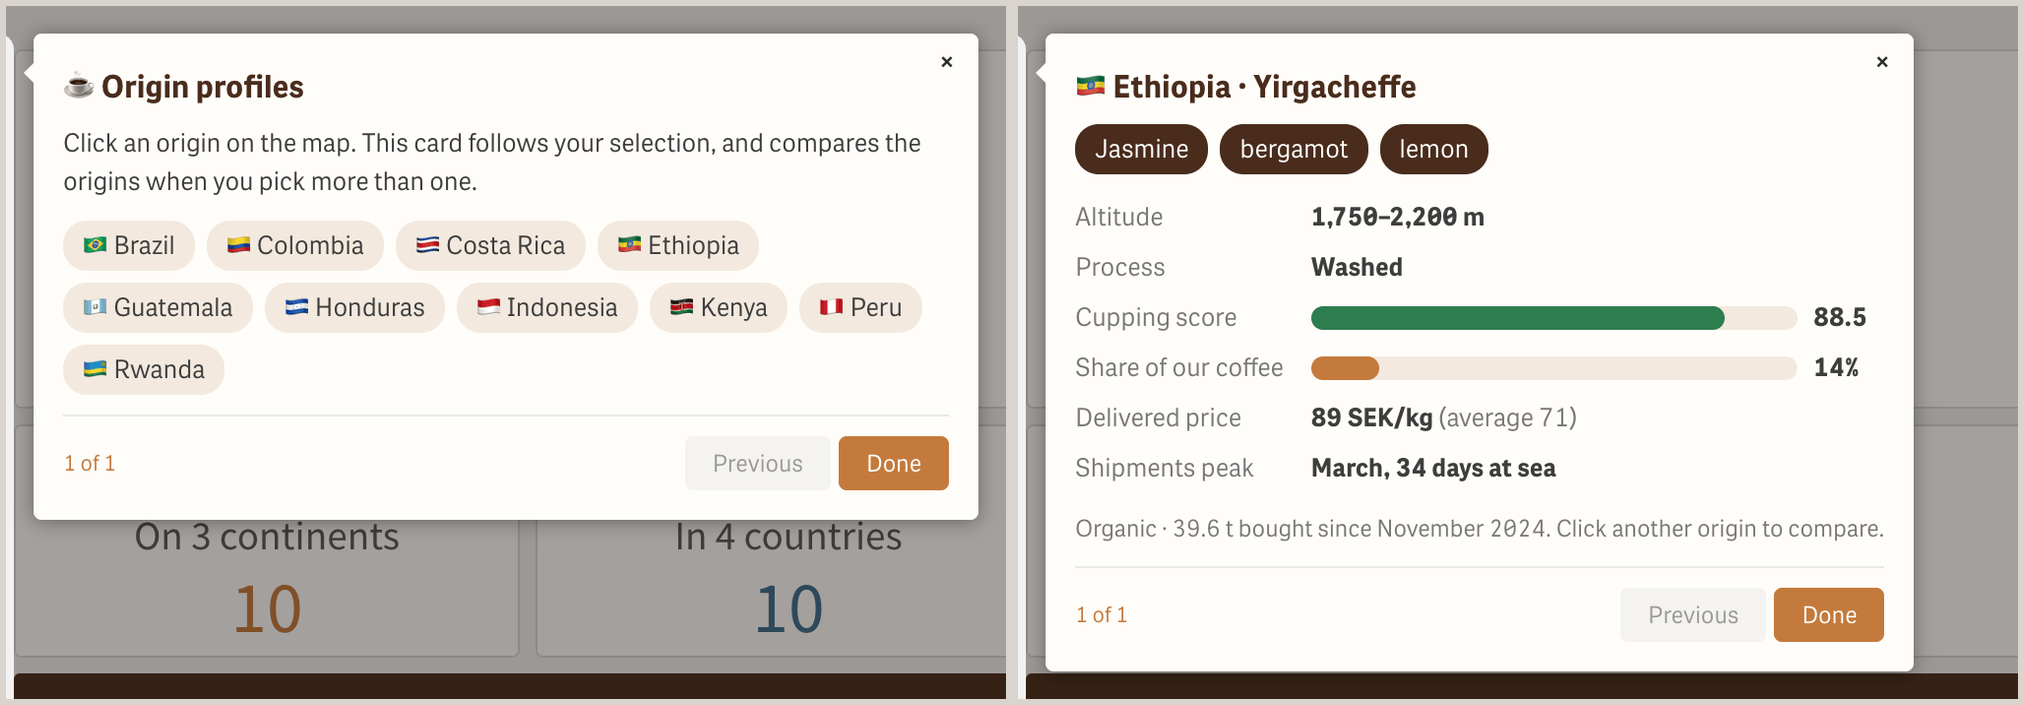
Add Colombia to the selection and the same step switches to a comparison of the two. Its title is an expression as well, so the heading changes with it:
If(GetSelectedCount(Origin) = 1, Only(Flag) & ' ' & Only(Origin) & ' · ' & Only(Region),
   If(GetSelectedCount(Origin) > 1, 'Comparing ' & GetSelectedCount(Origin) & ' origins',
      '☕ Origin profiles'))
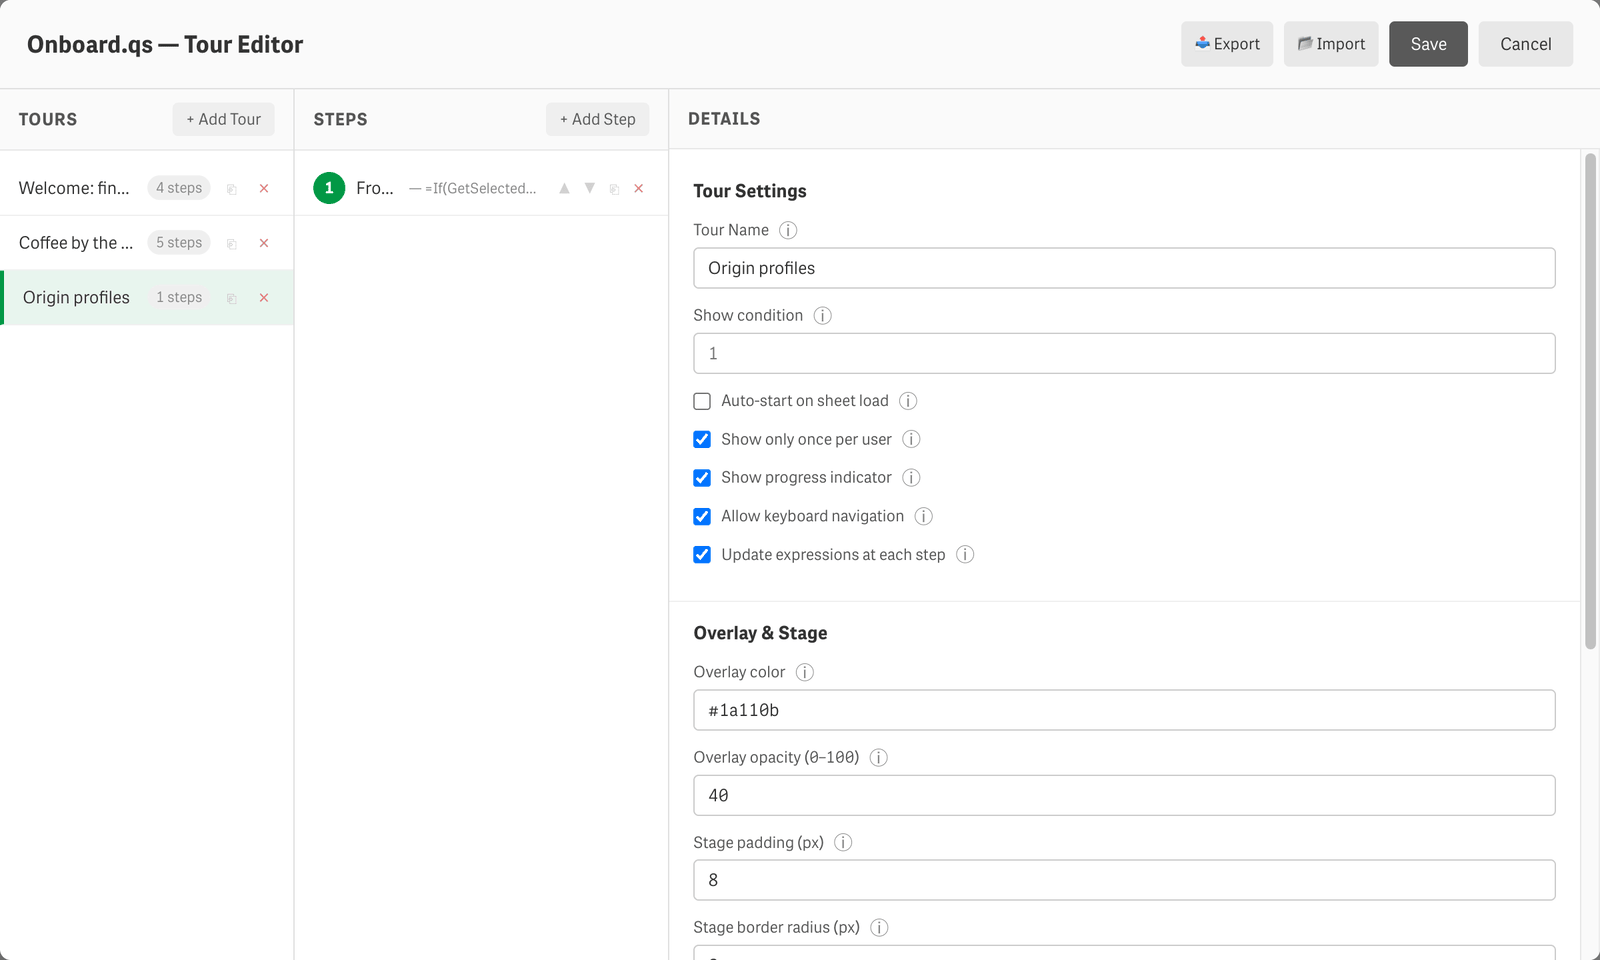
In the tour editor it is one checkbox, per tour, and it is off by default — a tour that walks people around a toolbar has nothing to recompute:
Two other items from that list are gone too, both in releases since: tall step dialogs now stay inside the browser window, and the progress text is configurable per tour, so a Swedish tour can say 1 av 7 instead of 1 of 7.
Getting the app
The video was recorded with Onboard.qs 1.10.0 on Qlik Sense Enterprise on Windows, May 2026 Patch 3. The app itself needs 1.9.0 or later — anything older has no Update expressions at each step, and the Origin profiles step will simply stand still.
Get the app and the extension. The button downloads the coffee app as a .qvf; import it in the QMC under Apps. The extension is a separate, free download: get the latest Onboard.qs release and import the onboard-qs.zip inside it under Extensions, in the QMC on client-managed Sense or the Management Console on Qlik Cloud.
The sales demo apps from the previous post are in the same folder, in English and Swedish.
Open the app, let the welcome tour run, then go into edit mode and open the tour editor. Every expression in this post is in there to read, copy and take apart. The demo app tutorial does the same job for the two sales apps, sheet by sheet.
The rest of the bench
Onboard.qs is one of a set of open source tools for Qlik Sense I've been building for years. All free, all on GitHub, all in use in real environments. If this one was useful, its neighbours might be too.
Inside the app, for the people using it:
- HelpButton.qs — a help button on the sheet: context-aware help menus, a feedback dialog with a star rating that POSTs to a webhook, and Markdown tooltips on any object. Onboard.qs is the proactive half of an in-app UX layer, HelpButton.qs the reactive one: guidance up front, help when someone goes looking for it.
Around the app, for the people running it:
- Butler Sheet Icons — creates sheet thumbnails from what each sheet actually looks like, across many apps at once, on Cloud and client-managed. A cross-platform binary, built to sit in a pipeline or a scheduled task.
- Ctrl-Q — the command line for Qlik Sense Enterprise admin and DevOps work: tasks, apps, master items, bookmarks and more, scriptable and greppable.
- Ctrl-Q QVD Viewer — open a QVD in VS Code and read its metadata, fields and rows without a Sense engine in sight, then export it to Parquet, CSV, Excel, JSON and a handful of others.
- Butler and Butler SOS — reload failure alerts, a task scheduler and a key-value store for the first; real-time operational metrics into InfluxDB, Prometheus or New Relic for the second. Add Grafana and you can watch a Sense cluster breathe.
That's the short list; ptarmiganlabs.com has the rest.
Onboard.qs is MIT licensed, free to use, modify and share. If you find it useful, please give it a ⭐ on GitHub. It helps other Qlik developers find the project, and it's the clearest signal I get about how widely these tools are actually used.