Onboard.qs demo apps: onboarding and storytelling in Qlik Sense
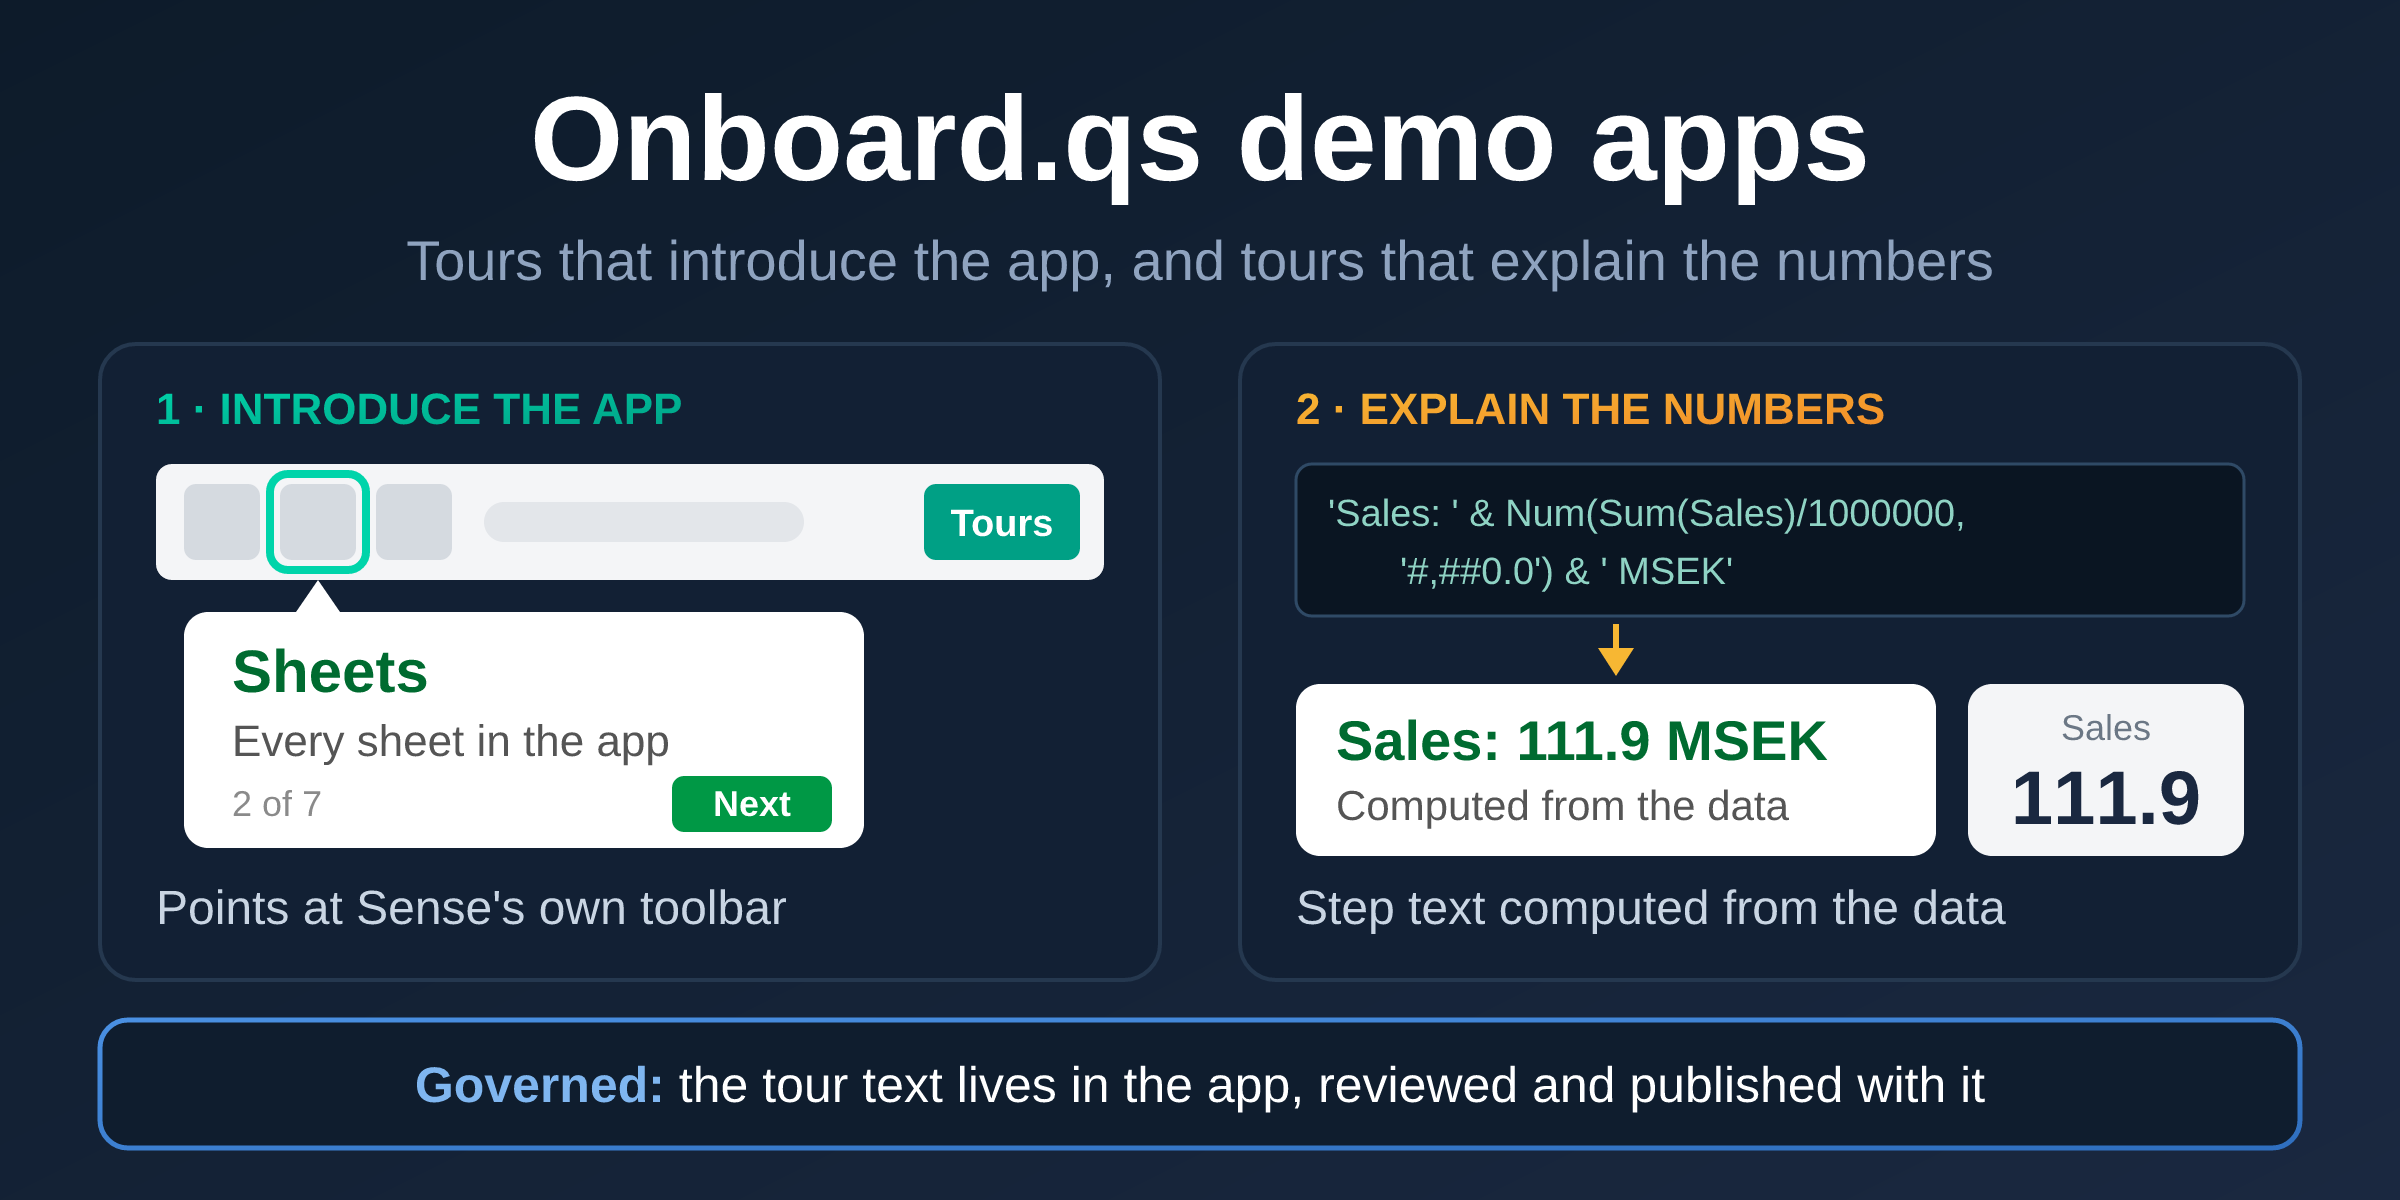
Two demo apps, one in English and one in Swedish, show Onboard.qs doing two jobs: walking new users around a Qlik Sense app, and telling them what the numbers say, in text computed from the data that goes through the same review and publishing as the app itself.
On this page
Many Qlik Sense apps leave their users with two questions.
The first is about Sense itself. Someone opens the app for the first time and doesn't know that the sheets are listed behind a button in the toolbar, what a bookmark is, or where their selections went. They aren't confused by your charts; they never got as far as your charts.
The second is about the numbers. A user looks at a bar chart and draws a conclusion: maybe the one you intended, maybe not. The conclusions an app owner wants people to draw usually end up somewhere else, in an e-mail, a slide or a wiki page, written once against last quarter's data and never touched again.
Qlik Sense's own storytelling solves related challenges, but with a narrower, end-user driven use case. You take snapshots of charts, put them on slides with your comments, and play the story like a presentation. That's easy to pick up, for end users too. But a Sense native story does not really blend in with the app itself; it's simply not meant to be a tool for providing commentary on the data as you interact with it. Instead, it plays in a view of its own, away from the sheets people work in.
Onboard.qs can help with both questions. It's a free, open source Qlik Sense extension that adds guided, step-by-step tours to an app (the launch post covers the basics). It's also more flexible than a story. A tour runs on the sheets themselves, can point at anything on the screen, from a chart to Sense's own toolbar, and its text can be worked out from the data in front of the user. That makes for onboarding and storytelling that feel like part of the app rather than something beside it. To show what that looks like in a real app, I've built two demo apps around it, and this post walks through them.
Try the tours yourself. Download a demo app and import it in the QMC along with the free Onboard.qs extension. Open the first sheet and the welcome tour starts by itself. The load script generates the data, so there is nothing to connect.
The button gets the English app. The Swedish app is here.
Two demo apps, four sheets, four ways to set up a tour
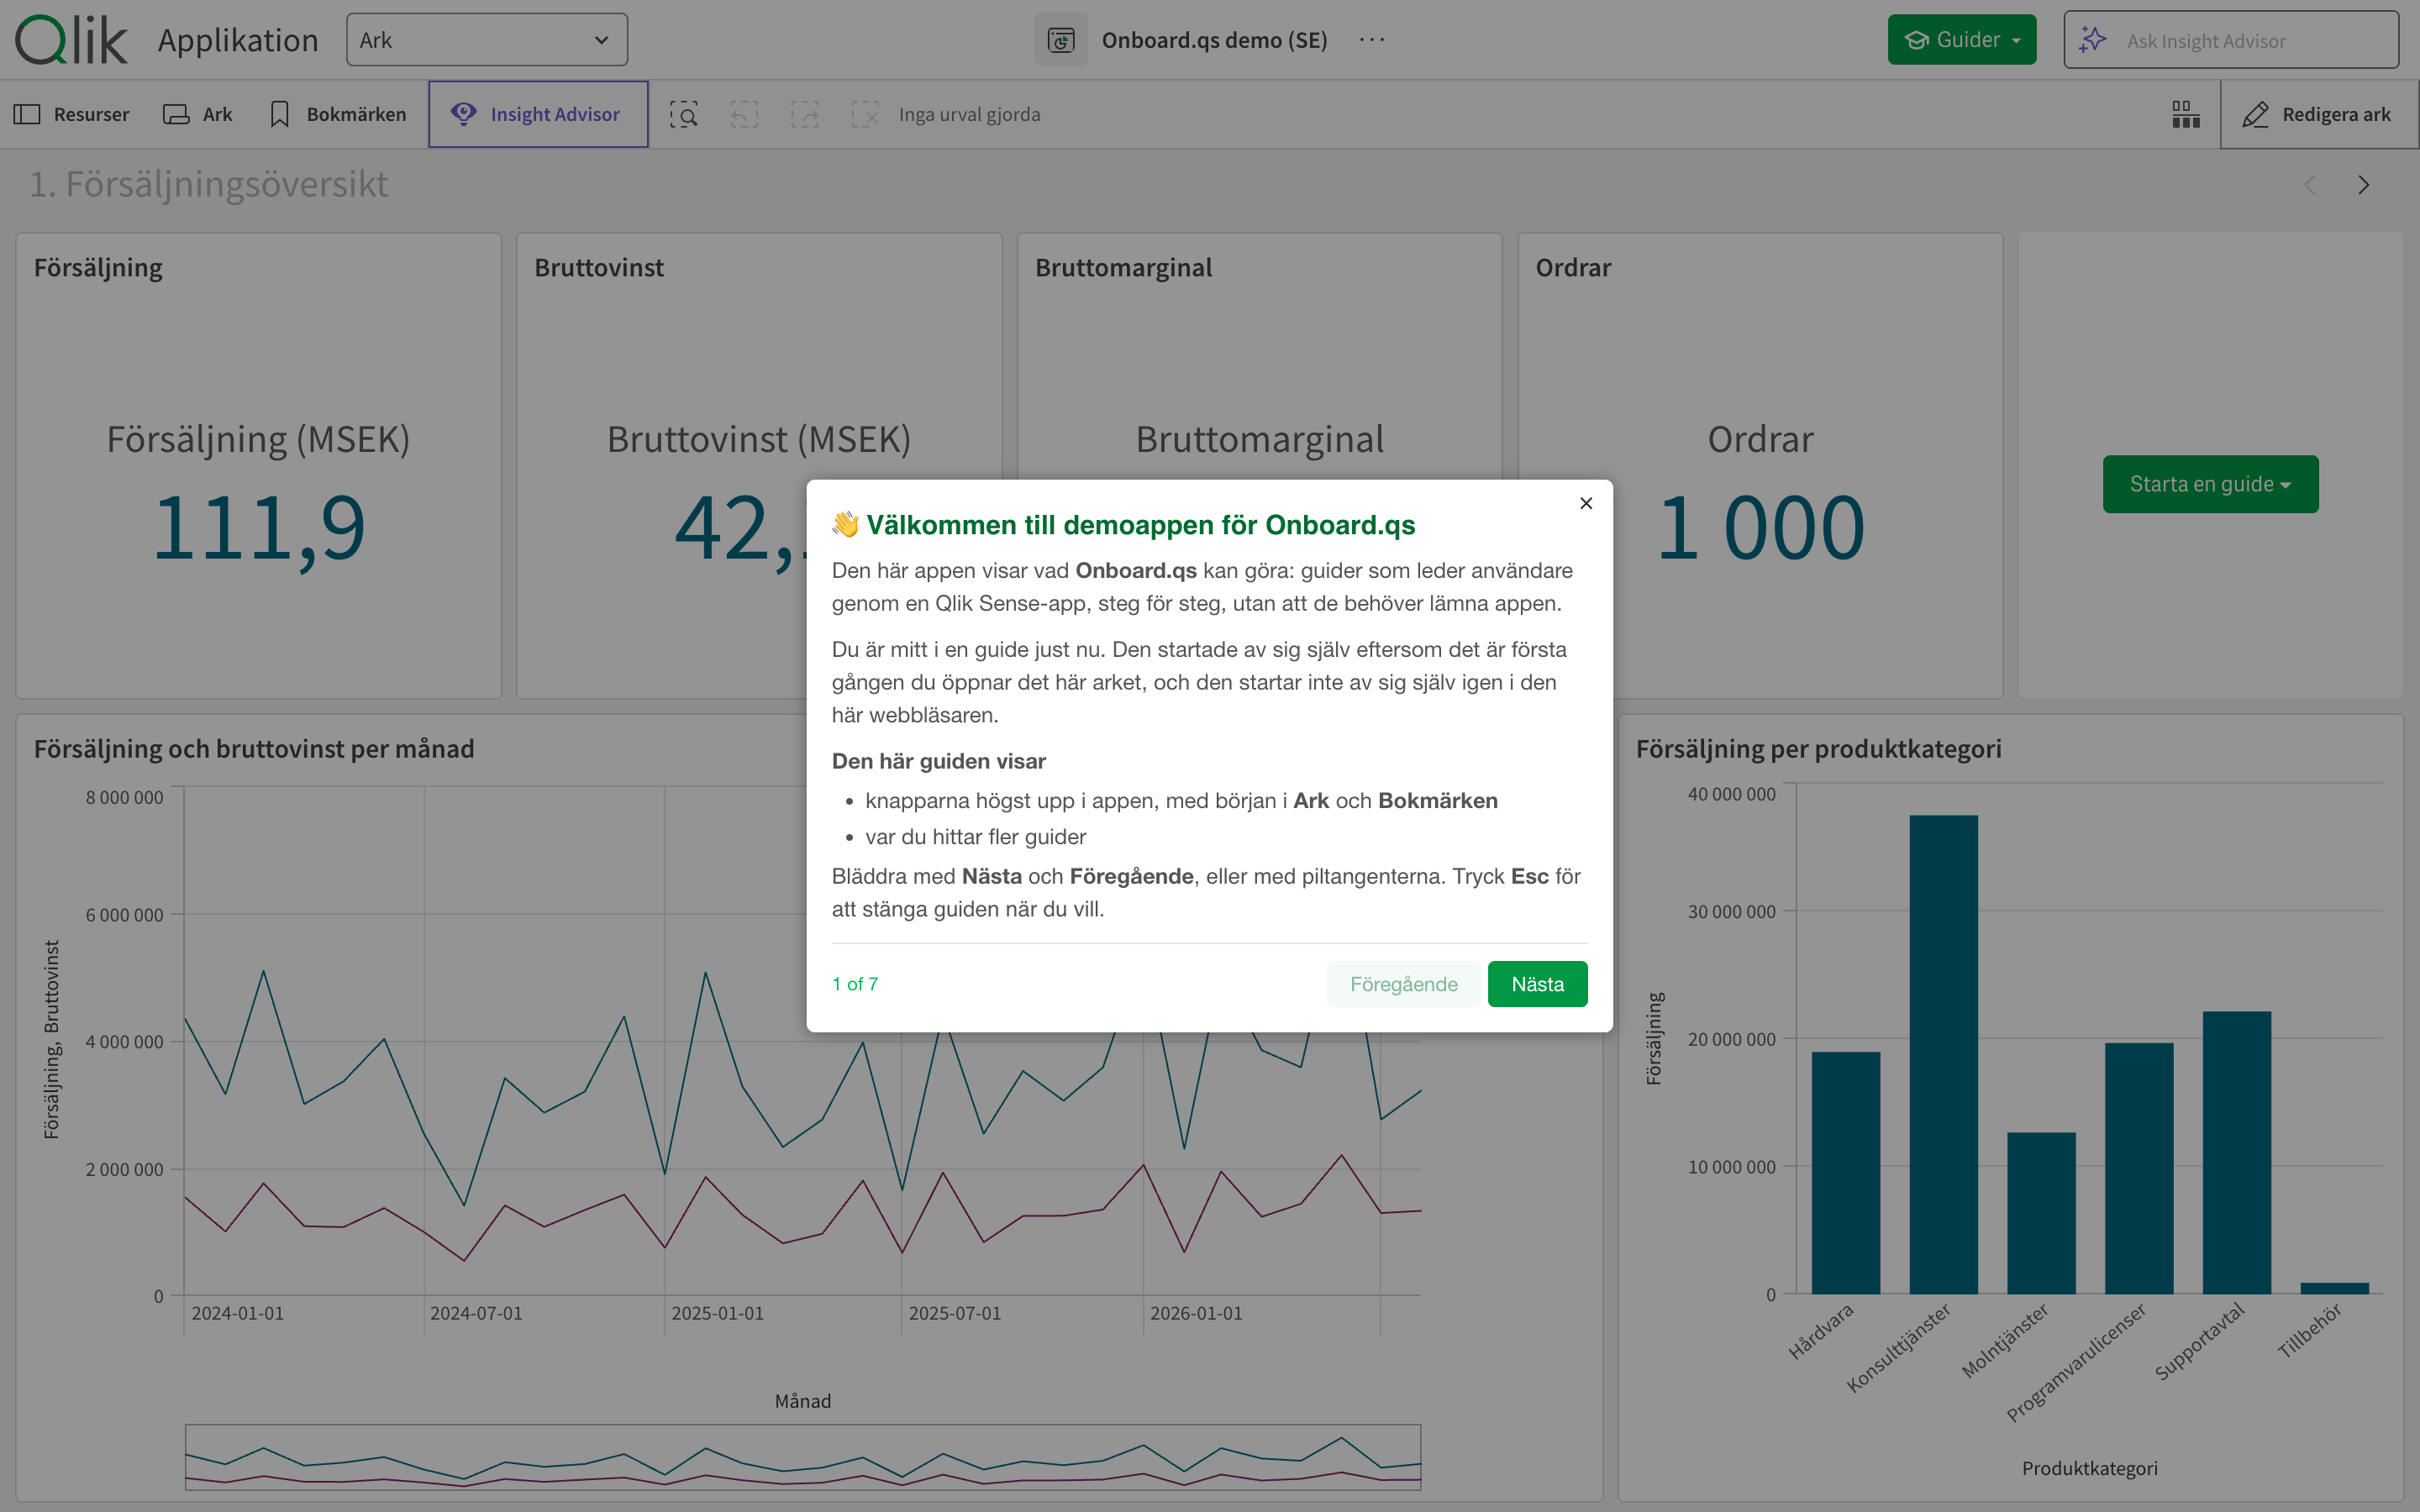
There are two apps: Onboard.qs demo (EN) and Onboard.qs demo (SE). They have the same sheets, the same charts and the same tours; the Swedish one is Swedish throughout, down to the button labels. Both run on a generated demo data set, which the load script creates itself, so the apps need no data connections: 1,000 orders from January 2024 to August 2026, 24 customers in 11 countries and 47 employees, with amounts in Swedish kronor.
They were built with Onboard.qs 1.8.2 on Qlik Sense Enterprise on Windows, May 2026 Patch 3. Onboard.qs itself runs on Qlik Cloud too, but the welcome tour's steps were written for the client-managed toolbar and haven't been tried on Qlik Cloud.
Each of the four sheets has one Onboard.qs object, set up differently on purpose, so the apps double as a tour of the extension's options:
| Sheet | Tours | Started from | Shows off |
|---|---|---|---|
| 1. Sales overview | Welcome: find your way around (starts by itself), Reading the sales overview | A button on the sheet, and a Tours button Onboard.qs adds to the Qlik toolbar | Steps that point at Sense's own toolbar; titles and texts that are Qlik expressions; a step the user can click through |
| 2. Products & profitability | Profitability explained, Deep dive: ‹category› | A pill-shaped button | An HTML table inside a step; a tour that is only offered when one category is selected |
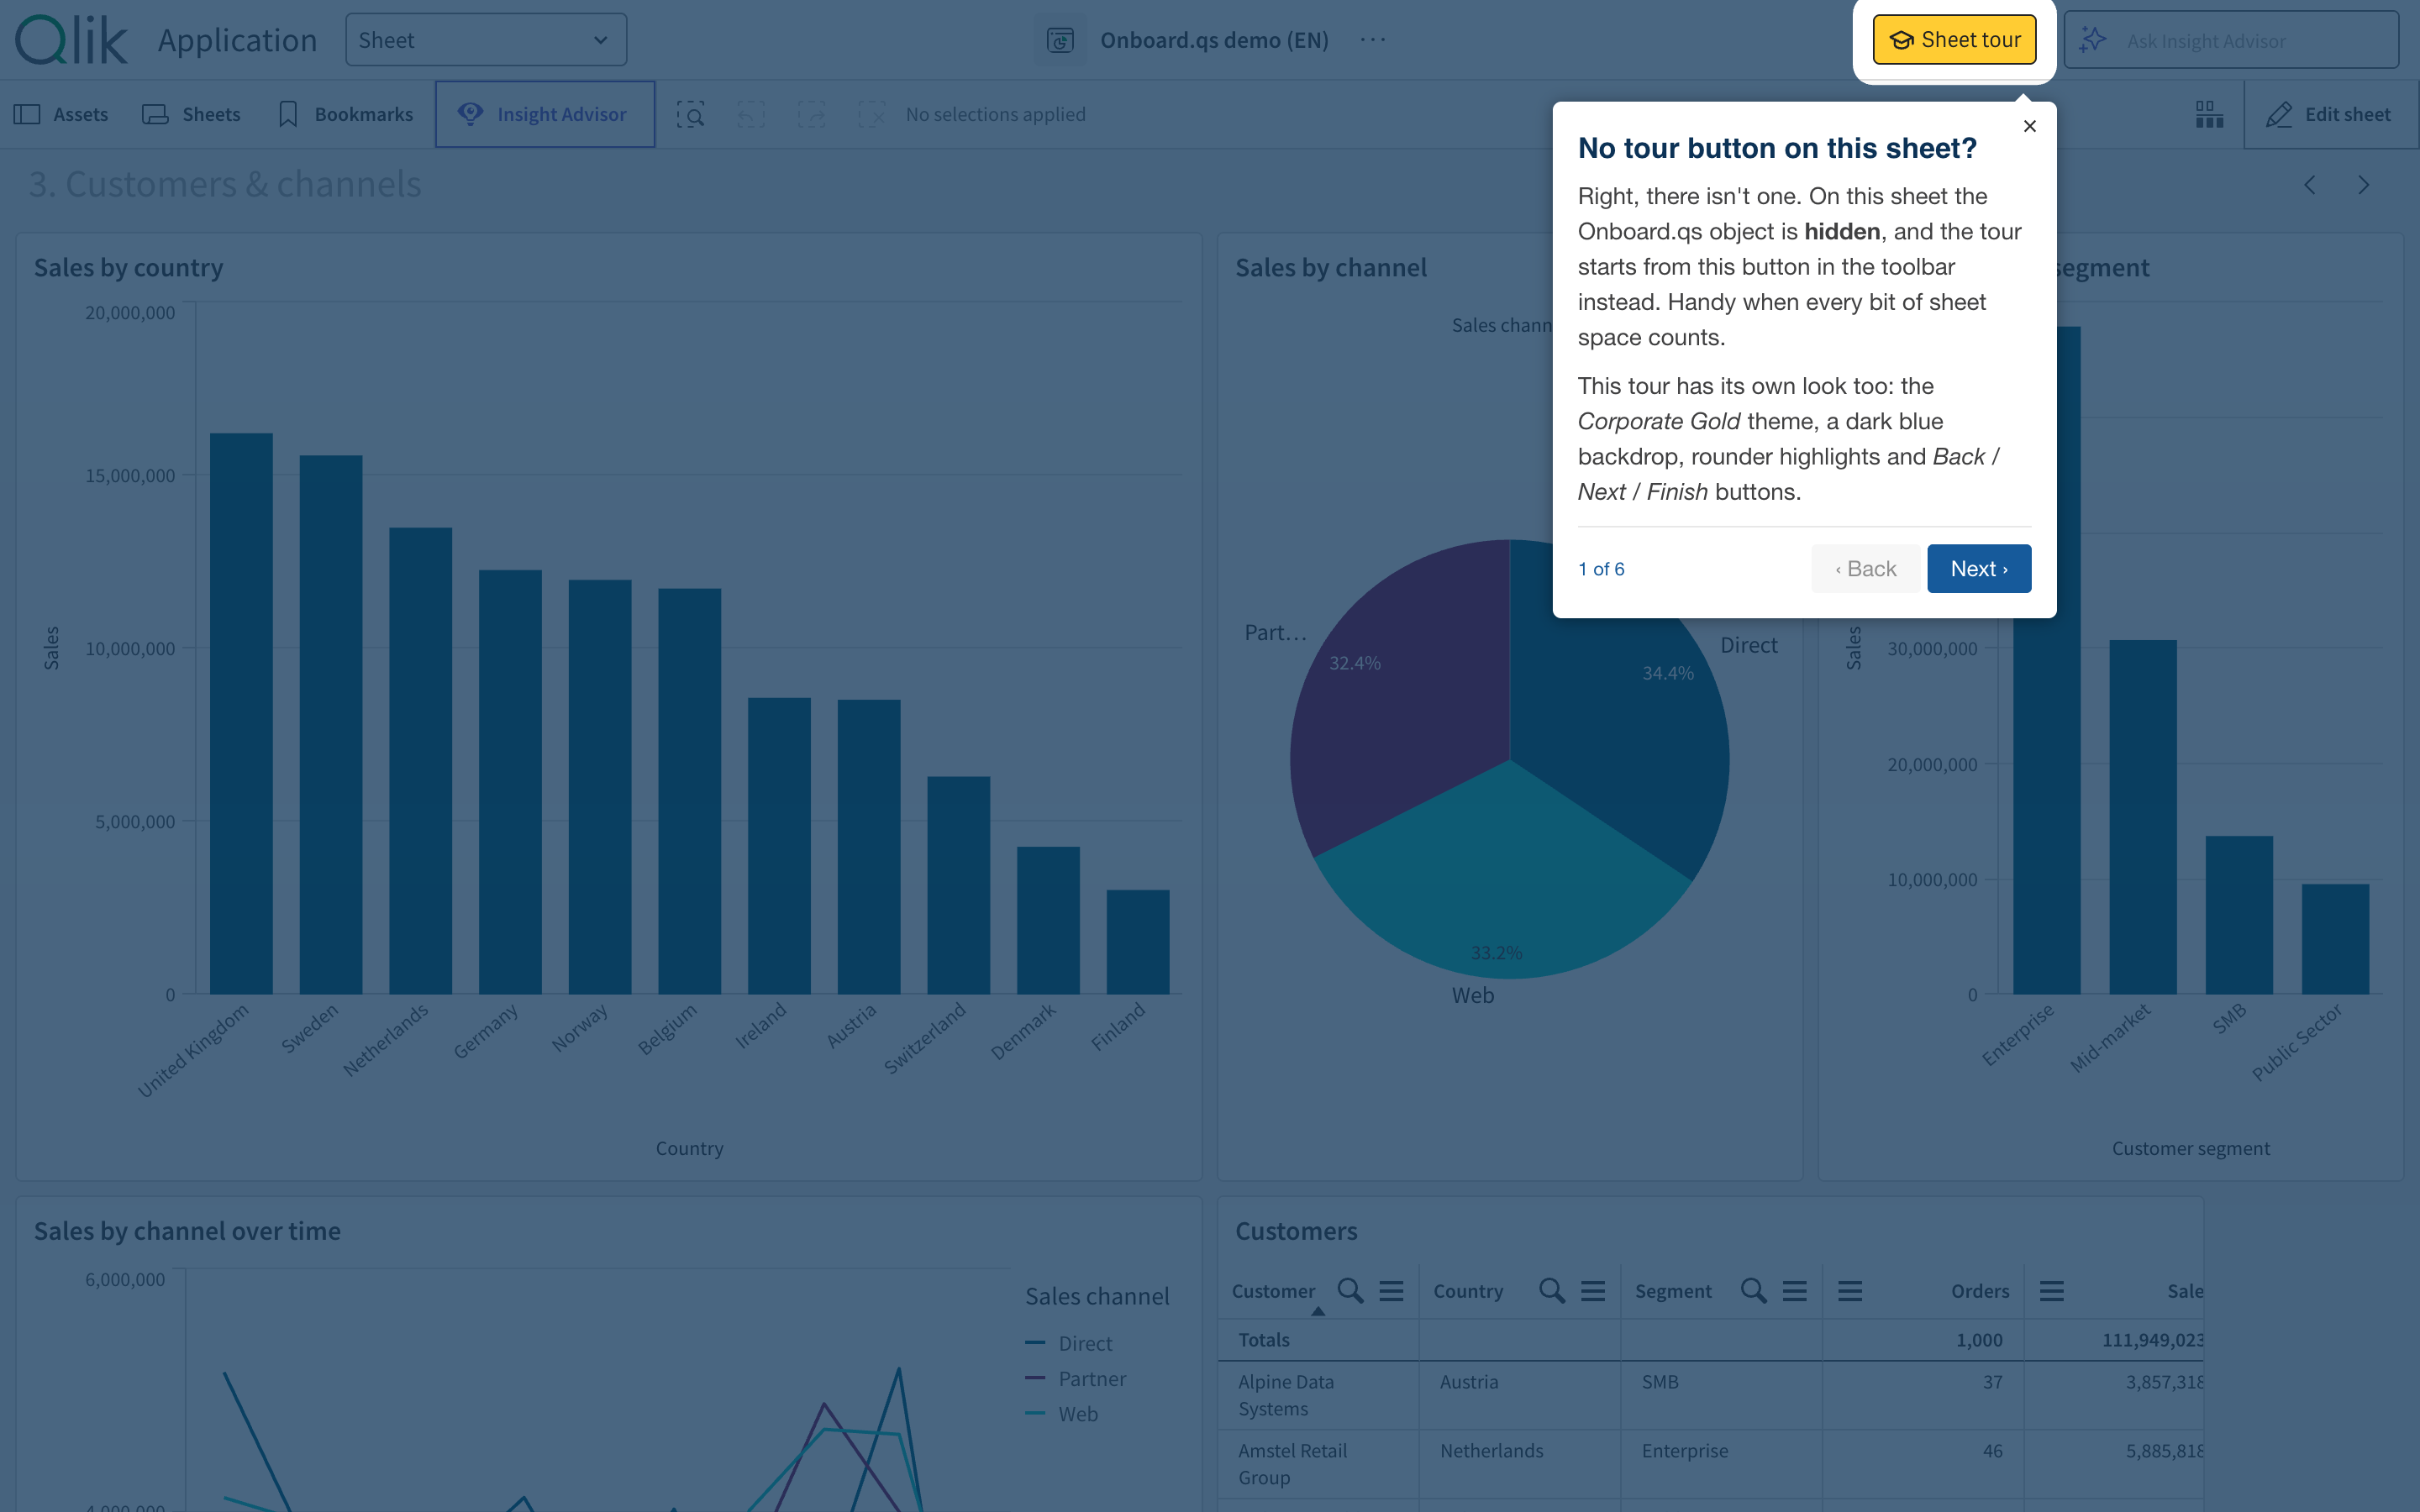
| 3. Customers & channels | Customers and channels | A Sheet tour button in the toolbar; the object itself is hidden | Its own overlay colour, rounder highlights and ‹ Back / Next › / Finish buttons |
| 4. Organisation | The organisation | A full-width banner button | A closing dialog with a picture of the tour editor and how to build tours |
Each sheet also uses a different one of the four built-in themes: The Lean Green Machine, Corporate Blue, Corporate Gold and Default.
Get the Onboard.qs extension. It's free and open source, and the latest release is always on GitHub. Download the release zip and import the onboard-qs.zip inside it: in the QMC under Extensions on Qlik Sense Enterprise on Windows, or in the Management Console on Qlik Cloud.
Job one: introduce the app, and Sense with it
The first time someone opens the Sales overview sheet, the welcome tour starts by itself. It does that once per browser: Onboard.qs remembers that the tour has been shown, and doesn't start it again.
The interesting part is what it points at. Most of its steps aren't about the app's charts at all. They're about the Qlik Sense toolbar above them:
- Sheets opens the sheet panel. The step explains that every sheet is listed there with a thumbnail, names the four sheets in this app, and mentions the ‹ › arrows for stepping between them.
- Bookmarks saves the current selections under a name. The step explains how to apply one and how to create one, and that bookmarks you create in a published app stay private until you publish them.
- Smart search searches all the data at once.
- The selections bar shows what's selected, one chip per field.
- And finally the Tours button Onboard.qs added to the toolbar, which lists the other tours on the sheet.
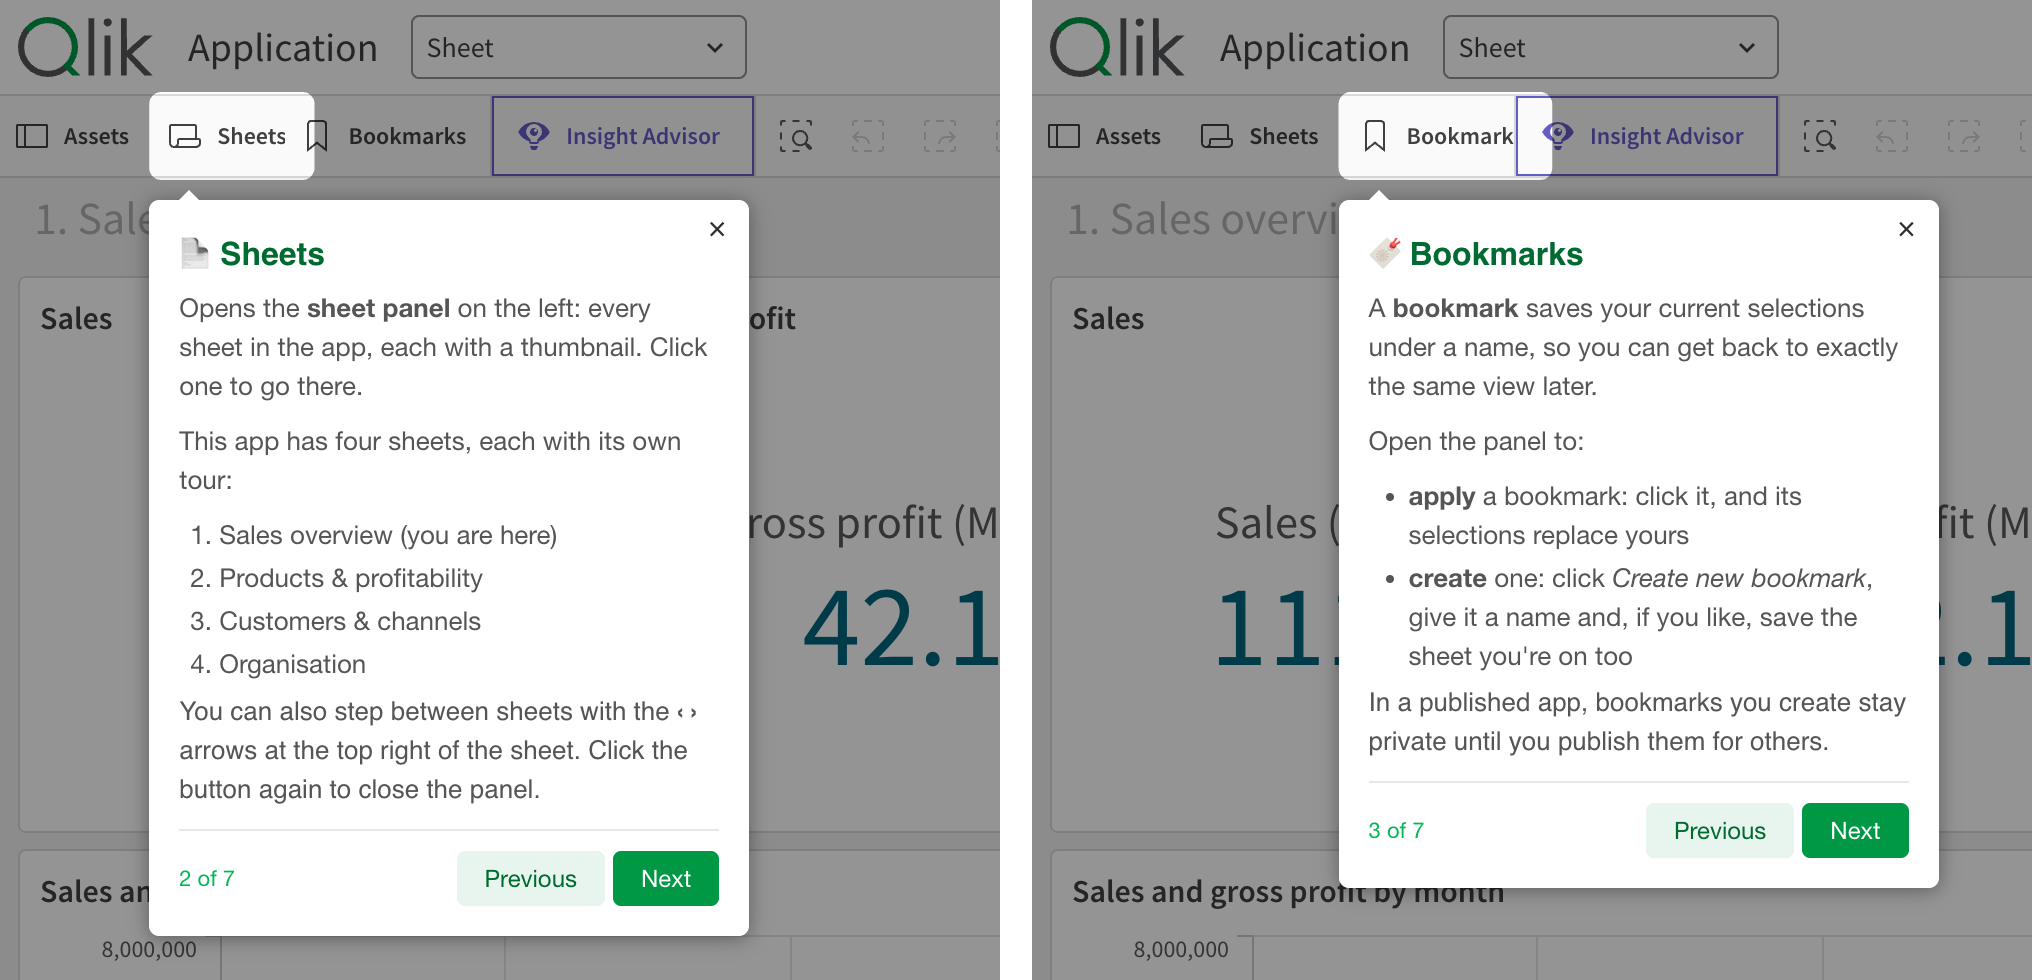
None of these are sheet objects, so the steps can't pick them from the list of objects. They use Onboard.qs's other way of choosing a target, a CSS selector: [tid="toggleGlobalSearchButton"] finds Smart search, for example. Picking a selector that keeps working takes a little care, and Pointing a step at the right thing, further down, shows how, with a table of selectors for the toolbar and the sheet.
Where a tour starts from is part of the introduction too. The first sheet offers both a Take a tour button on the sheet and the Tours button in the toolbar. The third sheet hides the Onboard.qs object altogether, and the first step of its tour points at the toolbar button to say so: handy when every bit of sheet space counts.
Job two: tell people what the numbers mean
The second tour on the first sheet, Reading the sales overview, is a different kind of tour. It doesn't explain where things are. It explains what they say.
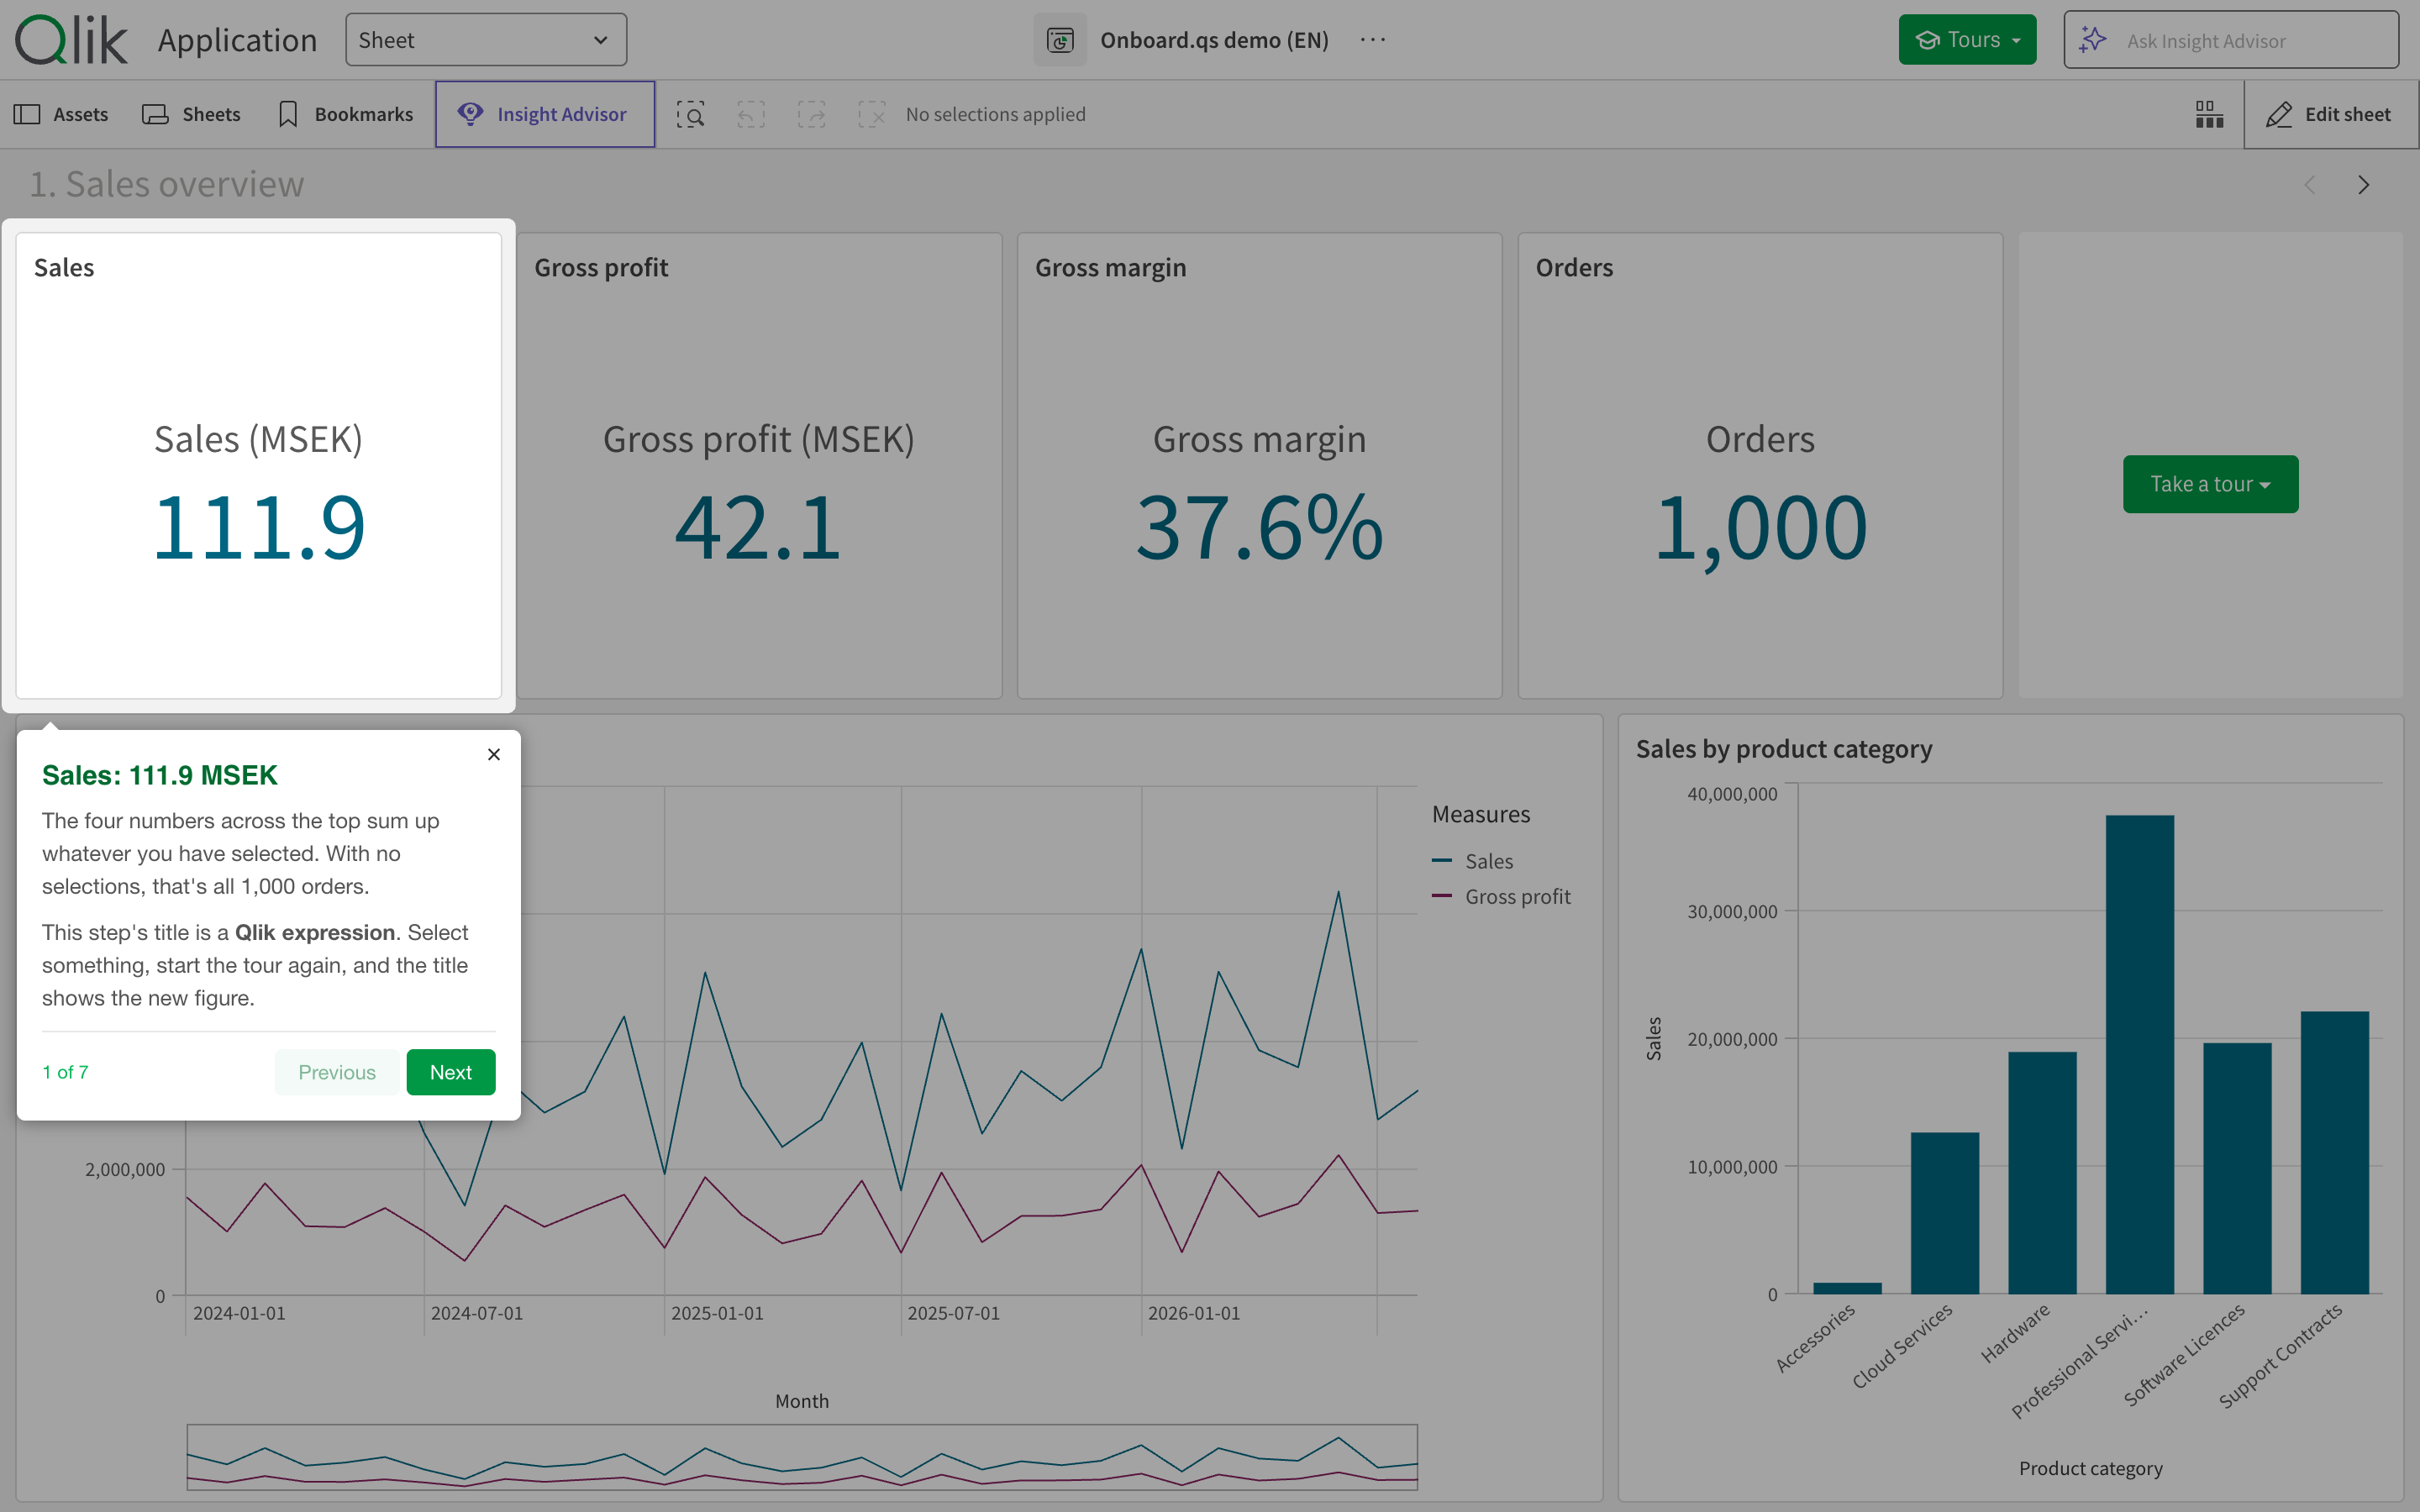
Its first step highlights the Sales KPI, and its title isn't typed text. It's a Qlik expression:
'Sales: ' & Num(Sum(Sales)/1000000, '#,##0.0') & ' MSEK'With nothing selected, the user sees Sales: 111.9 MSEK. Select a region and start the tour again, and the title shows that region's sales. The KPI underneath computes Sum(Sales)/1000000 with the same number format, so the step and the KPI can't disagree.
The rest of the tours state the conclusions an owner of this app would want people to take away. Across the whole period:
- Sales are 111.9 MSEK over 1,000 orders, at a gross margin of just under 38%.
- Professional Services is the largest product category, at 37.5 MSEK and a 37% margin. Software Licences is the most profitable, at 59%, while Hardware and Accessories keep only about a quarter of what they sell.
- The Nordics are the largest region, followed by DACH. The United Kingdom and Sweden lead the 11 countries.
- Direct, Partner and Web each bring in about a third of sales, and Enterprise customers account for about half, nearly twice as much as the mid-market.
- Of the 47 people in six divisions, only the 12 account executives carry sales.
A chart shows that Software Licences have a tall margin bar; the tour says, in words the app owner chose, that this is the most profitable part of the business.
A Qlik Sense story could make some of the same points. Storytelling is built for end users: anyone using the app can collect snapshots and build a story, even in a published app, and share it with others. Tours give the app's developer more to work with. The message appears on the live sheet, next to the chart it's about, rather than in a separate slide show. Its figures come from the data as it is today, not from the day a snapshot was taken. And it can be set to appear only when it applies.
The Products & profitability sheet goes a step further. Its second tour, Deep dive, has a show condition:
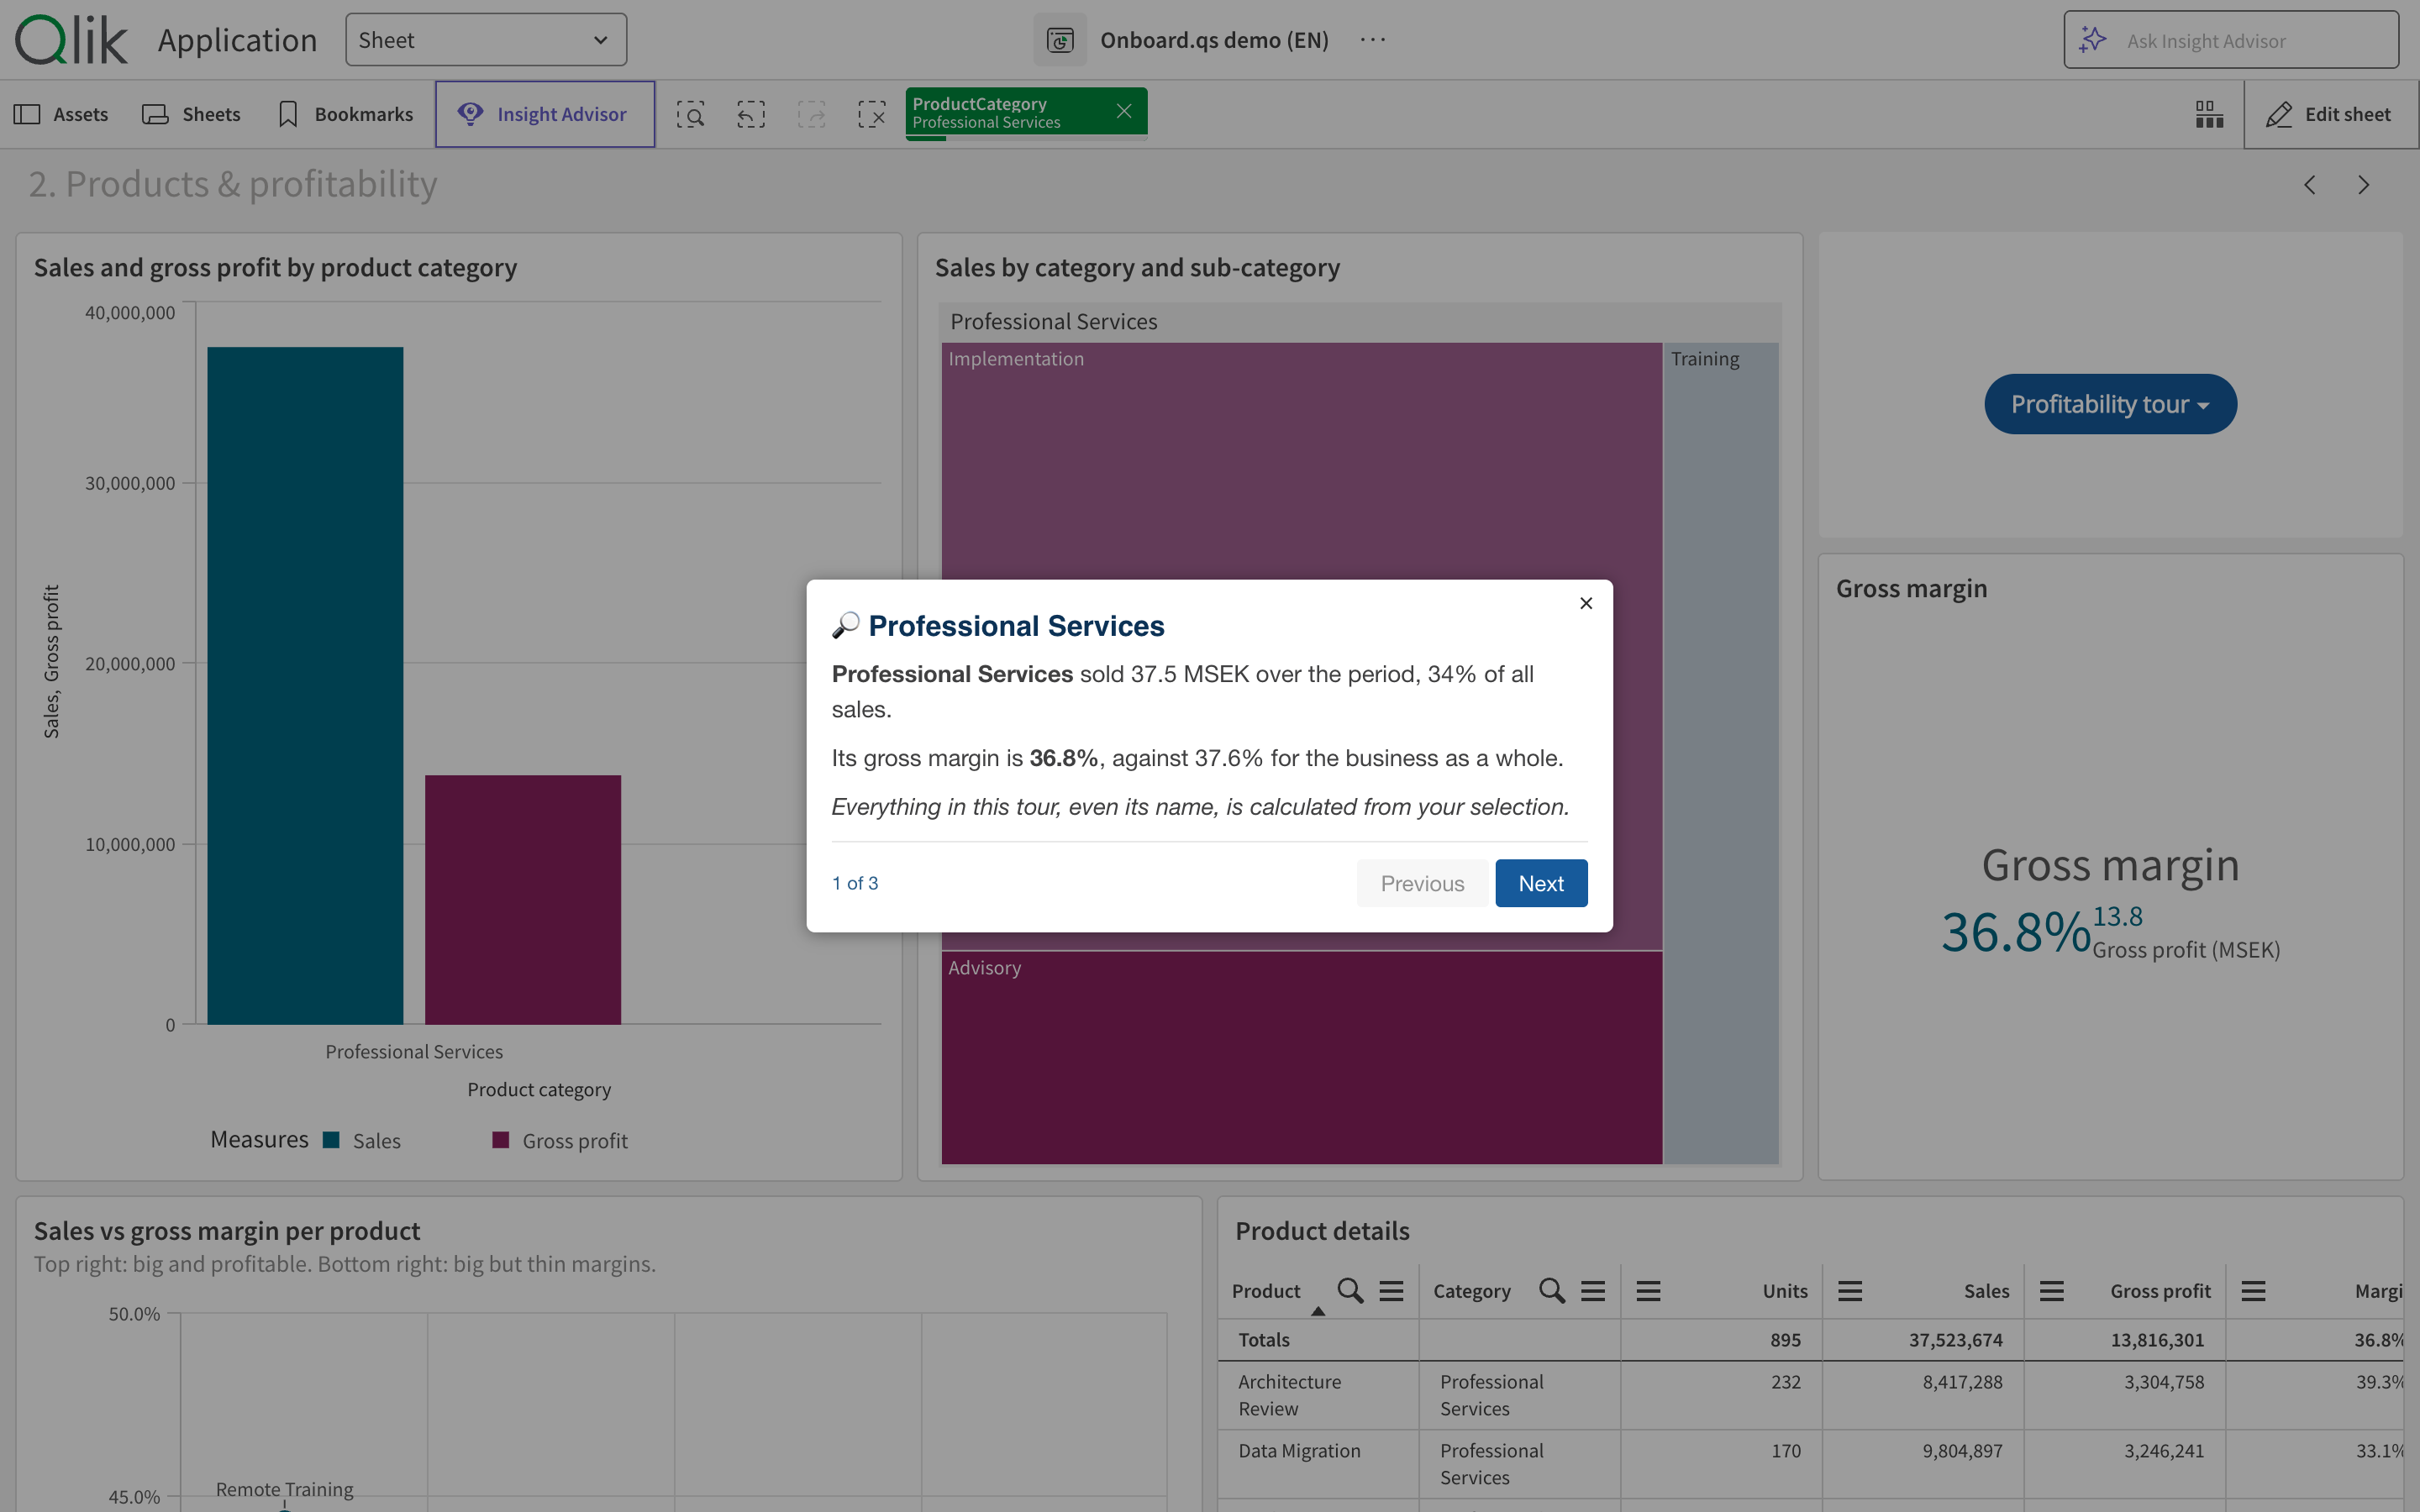
If(GetSelectedCount(ProductCategory) = 1, 1, 0)Until exactly one category is selected, the tour isn't offered at all. Select one, and it shows up next to the first tour, named after the category, because the tour's name is an expression too: 'Deep dive: ' & Only(ProductCategory). Every text in it is computed. With Professional Services selected, its first step reads: Professional Services sold 37.5 MSEK over the period, 34% of all sales. Its gross margin is 36.8%, against 37.6% for the business as a whole. The comparison with the whole business comes from {1} set analysis, which ignores the selection:
'Its gross margin is ' & Num(Sum(GrossProfit)/Sum(Sales), '0.0%') & ', against ' &
Num(Sum({1} GrossProfit)/Sum({1} Sales), '0.0%') & ' for the business as a whole.'
The next step names the category's best seller and the product with the best margin, using FirstSortedValue().
Why this is a governed way to inform users
"Governed" usually describes data in a Qlik Sense environment. It applies just as well to the messages about that data, and this is where Onboard.qs has something to offer.
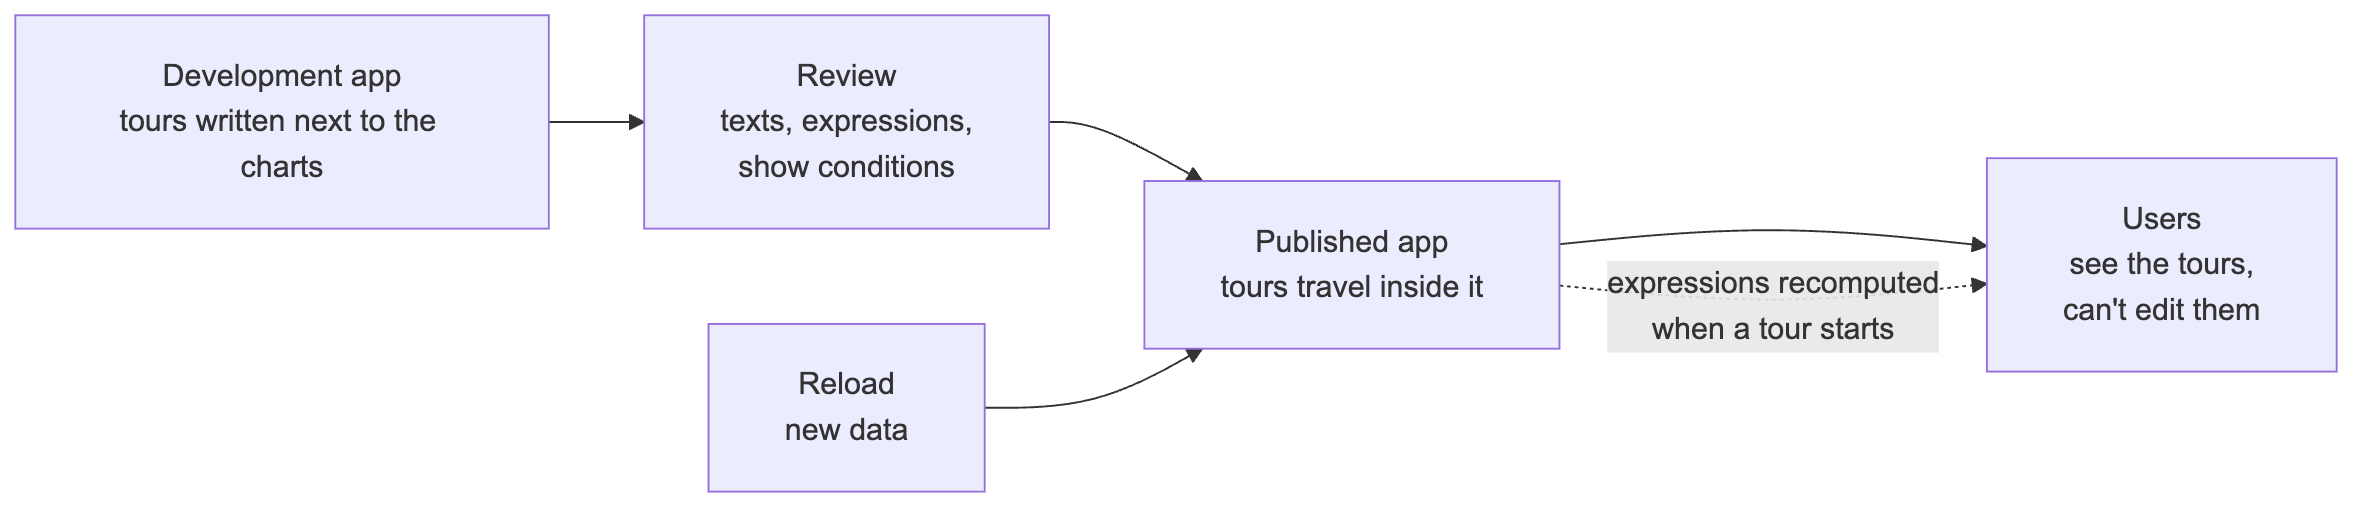
The text lives in the app. Tours are stored in the Onboard.qs object's properties, inside the app itself. They're created in the same environment as the charts and go through the same development, review and publishing as the rest of the app. People using a published app see the tours, but they can't change them. Compare that with a summary in an e-mail: nobody checked it against the data, and nobody will update it.
The figures come from the data. A title or description written as an expression is computed from the app's data model when the tour starts. After the next reload, the same tour reports the new figures, and with a selection it reports on the selection. If the KPI and the tour step use the same expression, or the same variable, there's one definition of "sales" and both use it.
Content appears only where it applies. Show conditions work on whole tours and on individual steps. The deep dive into one category appears when one category is selected. The same mechanism can hide a statement once it stops being true (more on that below).
A changed message is shown again. A tour that starts by itself and is set to show only once can be given a new version number. Everyone who saw the old version sees the new one, once, the next time they open the sheet.
Tours can move between apps. Tours export to a JSON file, all of them or a selection, and import into another app. That helps when the same message belongs in several apps.
Pointing a step at the right thing
Every step that isn't a free-standing dialog points at something on the screen, and Onboard.qs gives you two ways to say what.
A sheet object is the easy one. Pick the chart from the list in the tour editor, where each object is listed by its title and type, and Onboard.qs finds it on the sheet. It even copes with tab containers: if the chart sits on a tab that isn't showing, Onboard.qs switches to that tab before the step appears. Most steps in the demo apps work this way.
A CSS selector reaches everything else: Qlik Sense's own toolbar, the toolbar button Onboard.qs adds, or a single part of a chart rather than all of it. It's more flexible, and it's also where the surprises are. Three things are worth knowing:
- The selector is looked up when the tour reaches the step, and the step highlights the first element on the page that matches. A list such as
a, bdoesn't mean "trya, thenb". It means the first element that matches either one, in the order they appear on the page. - If nothing matches, the step isn't skipped. It shows as a dialog in the middle of the screen with nothing highlighted, while its text still talks about "this button". Run the tour after every change, and in every language your users have.
- Qlik Sense puts attributes meant for its own automated tests on many elements:
data-testid,data-tidandtid. They're the same in every language, which makes them the best hooks there are. They aren't a documented API, though, so run your tours again after each Sense upgrade. Avoidtitleandaria-label, which are translated, and class names that arecss-followed by random characters, which can change with any Sense release.
To find a selector for something new, right-click it in the browser, choose Inspect, and look for one of those attributes on the element or close to it. Then test it in the browser's console before you put it in a tour. document.querySelectorAll('[data-tid="assets-button-sheets"]').length should return 1.
Tooltips are the trap to look out for. The Sheets button's tooltip reads Show sheets in English and Visa ark in Swedish, and turns into Hide sheets while the panel is open, so a selector built on title only works in the languages and states you thought of. The button's data-tid stays the same through all of that, and it's what the demo apps use.
These selectors were tested on Qlik Sense Enterprise on Windows, May 2026 Patch 3, with the Sense interface in English and in Swedish. Each matched exactly one element in both languages. The object IDs are from the demo apps: KsqYxGx is the Sales KPI on the first sheet.
| What to point at | CSS selector | Notes |
|---|---|---|
| Sheets button | [data-tid="assets-button-sheets"] |
Used in the demo apps. Any language, panel open or closed |
| Bookmarks button | [data-tid="assets-button-bookmarks"] |
Used in the demo apps. Any language, panel open or closed |
| Smart search | [tid="toggleGlobalSearchButton"] |
Used in the demo apps |
| Selections bar | [data-testid="qs-sub-toolbar-selection-list"] |
Used in the demo apps. The whole bar, with or without selections |
| Onboard.qs's toolbar button | #oqs-toolbar-container |
Used in the demo apps. There when a tour object on the sheet has its toolbar button turned on |
| Assets button | [data-tid="assets-button"] |
|
| Insight Advisor button | [data-testid="sub-toolbar-explore-button"] |
|
| Step back, step forward | [data-testid="current-selections-back"], [data-testid="current-selections-forward"] |
|
| Clear all selections | [data-tid="current-selections-clear"] |
|
| The first selection in the bar | [data-tid="current-selections-item"] |
Only while something is selected |
| One field's selection | [data-tid="current-selections-item"]:has([data-testid="clear-ProductCategory"]) |
Put your field name in place of ProductCategory. Only while that field has a selection |
| Edit sheet button | [data-testid="toolbar-edit-button"] |
|
| Previous and next sheet | [data-testid="btnQuickNavPrevious"], [data-testid="btnQuickNavNext"] |
The ‹ › arrows at the top right of the sheet |
| Sheet menu in the top bar | [data-testid="navigation-dropdown-button"] |
|
| App name in the top bar | [data-testid="top-bar-app-center-name"] |
|
| Ask Insight Advisor box | [data-testid="insights-search-bar-container"] |
|
| The sheet's title | .sheet-title-text |
|
| A chart, by its ID | .qv-object-KsqYxGx |
What a sheet-object step uses behind the scenes |
| A chart's title | .qv-object-KsqYxGx .qv-object-title |
|
| A KPI's value | .qv-object-KsqYxGx [data-testid="kpi-value"] |
|
| A chart's axis title | .qv-object-kCNzeMi [data-key="dimension-title"] |
measure-title for the other axis |
| A chart's legend | .qv-object-NFlVZyL [data-key="legend-color-cat"] |
As found on a line chart |
| A chart, by its title | .qv-object:has([tid="chart-header"][title="Sales by product category"]) |
For tours you'll import into other apps, where the IDs differ. Breaks if the title changes |
Two notes on the table. An object's ID is in the qv-object-… class of its element, so Inspect finds that too. And individual bars, slices and points are drawn on a canvas, so a step can point at a chart or its axis, but not at one bar in it.
On Qlik Cloud the toolbar is built differently. Onboard.qs's own list of selectors uses [data-testid="top-bar-root"] for the top bar, [data-testid="qs-sub-toolbar"] for the toolbar under it and [data-testid="toolbar-edit-button"] for the Edit button there, the same hooks as on client-managed Sense, and charts have the same qv-object-… classes. The rest of the table hasn't been tried on Qlik Cloud.
What to watch out for
Building the demo apps turned up a few limits worth knowing about before you build something similar.
Expressions are evaluated once, when the tour starts. In Reading the sales overview, step 3 leaves the line chart clickable and invites the user to select some months. The KPIs on the sheet update at once, but the tour's last step still reports the figures from when the tour began. The demo is written around this: that step says "When this tour started you were looking at…", and suggests running the tour again after making a selection. Updating texts as the user moves between steps is filed as onboard.qs#280.
Typed sentences don't update. Only expressions follow the data. A sentence typed as plain text, such as "Professional Services is the biggest by far", is true for today's data, and it stays exactly as written after a reload that changes the picture. The category table in Profitability explained is typed HTML too, with the figures written in by hand. Either compute the statement, or guard the step with a show condition that checks it still holds. The demo apps do neither, but a guard for the sentence above would look like this, and the step would quietly drop out if another category took the lead:
If(FirstSortedValue({1} ProductCategory, -Aggr({1} Sum({1} Sales), ProductCategory))
   = 'Professional Services', 1, 0)
The {1} makes it ignore the user's selections, since the sentence is about the whole data set. The tutorial's section Keep the statements true covers both approaches.
"Show once" means once per browser. Onboard.qs uses the browser's local storage to keep track of which tours have been shown. Someone using a second browser, or one with its storage cleared, sees the tour again, and it isn't a record of who has read what.
Two smaller ones: a step whose content is taller than the browser window runs off the bottom of the screen (onboard.qs#281), and the "1 of 7" progress counter is fixed English text, the only English left in the Swedish app (onboard.qs#282).
Build your own
This post is the overview. For the developer's deep dive, the Onboard.qs repository has a tutorial built on the same two apps: Onboard.qs tutorial: learn it from the demo apps. It goes through them one sheet at a time: what users see, how each object is configured, and how to do the same in your own apps.
Download the demo apps. Both apps are free to download as .qvf files. On Qlik Sense Enterprise on Windows, import them in the QMC under Apps, with the Onboard.qs extension installed (see below). The load script generates its own data, so there are no data connections to set up.
The button gets the English app. The Swedish app is here.
The demo apps need the Onboard.qs extension, and so will your own apps:
- Download the latest release from GitHub. The release zip holds the extension file,
onboard-qs.zip. - On Qlik Sense Enterprise on Windows, import
onboard-qs.zipin the QMC under Extensions. On Qlik Cloud, add it in the Management Console under Extensions. - Then, in your own app, drag Onboard.qs onto a sheet in edit mode, open the tour editor and add a step.
Start with a welcome tour for your busiest app, pointing at the Sheets and Bookmarks buttons. Then pick the one conclusion you most want people to take from that app, and write it into a tour as an expression.
Onboard.qs is open source under the MIT license, free to use, modify and share. If you find it useful, please give it a ⭐ on GitHub. It helps other Qlik developers find the project, and it tells me how widely it's used.